How To Build Football Projections
I’m sure you’ve seen different analysts provide their projections for a player and questioned where in the world they got to those numbers. This article will examine how to build your own football projections so you can more accurately determine median outcomes and support your arguments on Twitter or with your leaguemates.
WHERE TO START
I hate talking to folks on Twitter who randomly assign values to players without looking at the grand scheme of the team. Always start at the team level first. By examining the total plays run by a team you can get a more accurate total of the sheer number of plays the offensive players will have to succeed. An easy way to get started on this is to head on over to pro-football-reference.com and take a look at the teams previous seasons total plays. From there, bake in your own assumptions about the team. Did this team have a coaching change? What will that do the total number of plays?


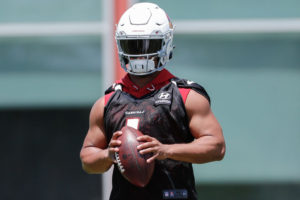
For this article, I will walk you through my projecting of the Arizona Cardinals. In 2019, the Cardinals ran 950 offensive plays (their sum of pass attempts and rush attempts). The Cards weren’t a playoff team and were often playing from behind in 2019. This offseason they added star WR DeAndre Hopkins and will be entering the second season of the Kliff Kingsbury scheme. I think this helps the team. I put the total plays for this team at 900 (or about 3 plays less per game than 2019) based on this team being able to be out front a bit more and chewing more clock.
RUN VS PASS PLAYS
Once you have determined a total plays number for a team the next step is to examine the run to pass ratio. Again, using ProFootballReference as a great data collection site, I go back and look at the breakdown of the plays the team had last year, and then bake in my assumptions. Again, is this team better? If so, maybe they aren’t as pass happy. Did this team get worse? They will probably have negative game script, so they’ll be throwing a bit more. If you want to really tighten your projections down, you can go back and look across multiple years if the same staff has been in place for awhile to get more coaching/play calling tendencies.
For the Cardinals, I think they will throw the ball a bit more than last season. Last season, the Cards attempted 554 passes. In year two for QB Kyler Murray and the addition of Hopkins with a bad offensive line, I think the Cardinals will take some of the run game out and utilize more short passes to WR Christian Kirk and RB Kenyan Drake as an extension of the run game. I have the Cardinals attempting 580 passes in 2020. Due to this, I have the Cardinals dropping from 396 rushing attempts in 2019 to 320 in 2020.
NOW TO THE PLAYERS
Once you have total plays and a pass to run ratio, the player projections are all just some math equations. I highly recommend using an application like GoogleSheets or Microsoft Excel to help with the calculations. Let’s start with the QB. We have already established that the Cardinals will have 580 pass attempts. I do not get a completion percentage or passing TDs for the QB until I’ve finished every other player on offense. We will come back to this.
I can establish a number of interception Murray is likely to throw based on his pass attempts. ProFootballReference has Murray’s interception percentage (number of passes intercepted divided by pass attempts) at 2.2%. I think this is safe number for Murray in that offense and his play style. By multiplying 2.2% by his 580 attempts (or .022 multiplied by 580) you come to 12.76 INTs for 2020. QBs run the ball too, and we need to figure out how much Murray will run in 2020. Looking at 2019, we can see Murray ran 93 times while his team ran the ball 396 times. Dividing 93 by 396 gives us 23.5%.

See Kyler Murray In Our 2020 Fantasy Draft Rankings!
So in 2019, Murray ran the ball nearly a quarter of his teams attempts. This number is called a rushing share. I have Murray posting a similar number of carries in 2020 at 90.2 carries, or a 28.1% rushing share. I think Murray opens his game up a bit in 2020. Next, we need to figure out the amount of yards that Murray will gain on 90.2 carries. In 2019, Murray averaged 5.8 yards per carry. I think Murray can do better than that in 2020, and I have him at 6.5 yards per carry, putting his rushing yardage at 586.3. To determine rushing TDs, the best practice I have found is to divide TDs by yardage.
If you dig into databases you can find a number that says “per every XX yards rushing we expect a TD.” I like to keep it specific to the player, and I call it a TD-to-yardage ratio. So for Murray in 2019 Murray scored four TDs on 544 yards. We divide 4/544 and get .00735. I then add my adjustments. Do I think Murray scores more on his projected 586.3 yards? I do, but just by a little bit. I have adjusted the TD-to-yardage ratio to .0075, giving Murray a projected 4.397 rushing TDs in 2020.
RB and WR rush shares are built the same way as we did with the QB. First, assign a rushing share. From there, assign a yards per carry to his attempts. Once you have a yardage you can create a TD-to-yardage ratio and have your full rushing stat line for your RBs. REMEMBER: You can only have 100% of the rushing and passing attempts. When you assign shares to players, ensure the total number of shares does not exceed 100%.

Don’t Shed a Tier: Quarterback Tiers for 2020
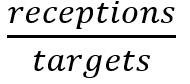
Receiving work is similar to rushing work. First, I assign a target share for my RB, WR or TE. The difference between rushing and receiving share is that a RB/WR/TE needs to actually catch the target for it to be a stat in fantasy football. ProFootballReference has catch percentages for every player in the NFL, and I use this and tweak them as I see fit. A catch percentage is the number of passes caught divided by the number of targets. I ask myself questions like “is this player a deep threat?” More than likely their catch percentage will be lower than a player like Julian Edelman who is a slot WR who does most of his damage near the line of scrimmage.
From there I examine the yards per catch that player has had historical, while baking in my own beliefs and assumptions. Sometimes I increase the historical data, sometimes I decrease it, this is where the variance in projections live. When projecting receiving TDs, I use the same TD-to-yardage ratio as I did with rushing TDs.
Once you’ve done this you can utilization the summation feature in Sheets or Excel and get a total number of completions and passing TDs for your QB. I won’t get into the basics of using Excel or Sheets, but you’ve just projected a stat line for each player! To create fantasy points, simply multiple each statistic by the points your league assigns.
THINGS TO REMEMBER WHEN YOU BUILD FOOTBALL PROJECTIONS:
- These are projections and not rankings. You are taking historical averages and tweaking them a bit. If the Cardinals only run 500 passing plays, my projection will be off by quite a bit. Use projections as your median outcome and build fantasy football rankings by examining the extremes of that player.
- Start on the team level first!
- You can’t make numbers up. You only have 100% of your rushing share and 100% of your target share. Don’t be that guy that says Stefon Diggs can easily get to 130 targets in Buffalo without doing the math.
- Pro-football-reference.com is a phenomenal tool.
- Utilize an app like GoogleSheets or Microsoft Excel to help crunch numbers.
- Try not to tweak the numbers to fit a narrative. Projections do the job of removing bias by simply assigning numbers to players. Just because you think Julio Jones should be the WR1 overall doesn’t mean you have to fudge the numbers to fit a narrative. Your numbers are telling you that you may need to adjust your expectations.
FORMULAS TO USE:
Interception Percentage = 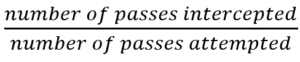
Rushing share = 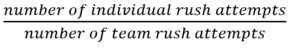
TD-to-yardage ratio = 
Catch percentage =