
 Compete in Weekly Drafts & Player Props Contests! Use Promo-Code: YARDSPER for a 100% deposit match up to $100!
2021 Projections Review – Part 1
Prior to the 2021 fantasy football season kicking off, I completed my full team projections for every team based on my assumptions of what I thought was a likely outcome for the season. If you haven’t done projections before, I wrote an article last offseason on how to do it and Yards Per Fantasy has a projections template that you can use. Both the article and the template will be updated this offseason so watch this space.

There’s a process to projections and it starts at the top, with team totals. How many plays are they going to run, what percentage of those plays are going to be pass plays, how many touchdowns are they going to score, and what percentage of those touchdowns are passing touchdowns.
I’m going to spend some time in the early part of the offseason working through my assumptions and comparing them to what played out. I’m not going to spin takes and try to justify whether I’m a genius or an idiot, I’m simply looking at the process and comparing it to the results so I can adjust moving forward.
One final note before we get in to this, I’m going to be comparing a 16 game pace and have calculated everything back on that basis. All previous seasons were 16 games so its easier to see the trends if we’re comparing apples with apples.
Total Plays
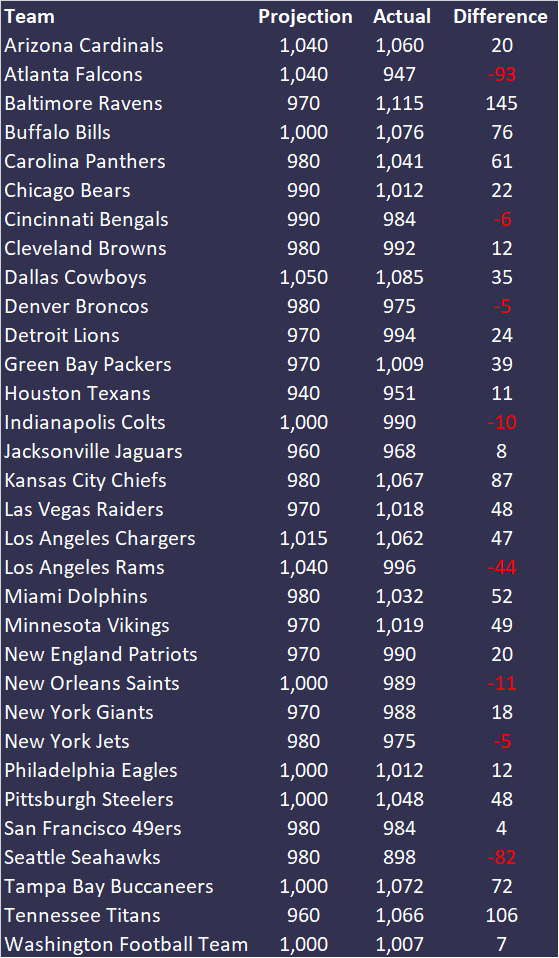
This table shows my projections of total plays for each team, their actual total plays (16 game pace) and the differences. Lets look at the big differences.
Baltimore Ravens ran 1,103 plays (pass + run) in 2018 and 1,036 plays in 2019 but in 2020 they ran 961. I projected more of the same from 2020, run more of the ball and burn more of the clock resulting in fewer plays. What actually happened was they increased their passing volume and ran more plays than any of the previous three seasons.
Tennessee Titans ran 891 plays in 2018, 893 plays in 2019 and jumped to 1,006 plays in 2020. When I projected the Titans I looked at 1,006 as an overcorrection from the previous two seasons but I didn’t wind them back much from there. I certainly didn’t project them to increase by another 60 plays. If you look at the gamelogs, three overtime games and a 52 pass attempt game against the Texans seems to explain the difference.

Atlanta Falcons went in the opposite direction. 968 and 1,046 plays in 2018 and 2019 respectively followed by 1,037 plays in 2020. A projection of 1,040 plays made perfect sense to me but they fell short of this mark by almost 100 plays. They just didn’t have an offense that moved the ball well enough, losing the time-of-possession battle in 10 games. And they had less than 24 minutes in four games.
The other big negative mover was the Seattle Seahawks. They ran less than 900 plays, a feat that’s almost difficult to achieve and one that no other team in the league managed in 2021. You simply can’t project a team to run that many plays and they’ll no doubt bounce back up somewhat in 2022.
Stats of Note
- Highest No of Plays: Baltimore Ravens (Projected Highest = Dallas Cowboys)
- Lowest No of Plays: Seattle Seahawks (Projected Lowest = Houston Texans)
- No of Teams with over 1,000 plays (16 game pace): 17 (Projected = 12)
- No of Teams with less than 950 plays (16 game pace): 2 (Projected = 1)
- Accuracy
- 22 teams projected within 48 plays (3 per game)
- 16 teams projected within 32 plays (2 per game)
- 11 teams projected within 16 plays (1 per game)
Takeaway
Generally speaking, the accuracy wasn’t too bad. General refinements of the estimates would hopefully get a little nearer but nothing too crazy to correct.
Pass Percentage
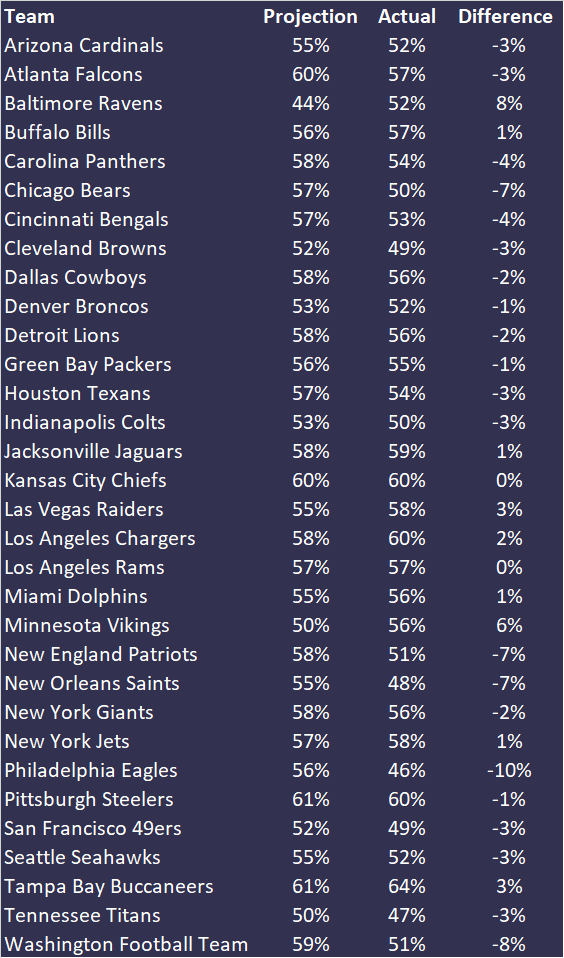
You have to go back to 2018 for the last time Baltimore had more pass attempts than rush attempts and that was marginal. In 2019 and 2020 it was significantly weighted towards the rush, so a run heavy projection made sense. With an actual pass percentage of 52-percent, I have to think this was a result of the running backs that were actually available to them after Dobbins and Edwards went out for the season.

On the flipside, the Philadelphia Eagles transition to a run heavy approach in the second half of the season is well documented, while the Washington Football Team hit a much lower pass percentage than I projected. Perhaps a result of a Fitzmagic injury, I’d bet that Washington’s pass percentage would be a fair bit higher if he’d played the whole year.
A few other teams of note. The Chicago Bears, New England Patriots and New Orleans Saints all ran at a higher clip than I projected while the Minnesota Vikings spun to a 56-percent pass rate after hitting 52-percent and 49-percent the previous two seasons. The Patriots and Saints in particular were much closer to a 50/50 split than I projected but in hindsight their unstable Quarterback situations should really have reigned me back in.
Stats of Note
- Highest Pass-Percentage: Tampa Bay Buccaneers at 64-percent (Projected highest = Tampa Bay and Pittsburgh)
- Lowest Pass-Percentage: Philadelphia Eagles at 46-percent (Project lowest = Baltimore)
- No of Teams with 50-percent or less passing: 7 (Projected = 3)
- No of Teams with 60-percent or more passing: 4 (Projected = 4)
- Accuracy
- 25 teams projected within 4-percent
- 13 teams projected within 2-percent
- 2 teams projected exactly
Takeaway
I’m not going to over-react and over-correct teams like Baltimore. Rookie and unstable Quarterback situations need a bit more thought to perhaps be more balanced in some scenarios.
Touchdowns
Note: this is looking at offensive Touchdowns only (passing + rushing)
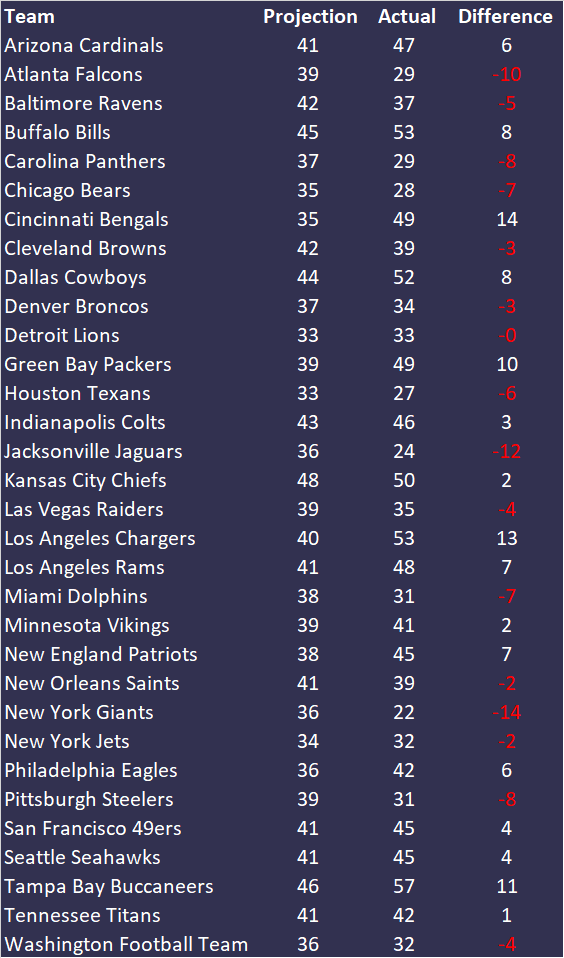
There’s a few big differences here so I’ll split in to the over-achievers and under-achievers.
Over-Achievers
- Cincinnati Bengals +14
- Los Angeles Chargers +13
- Tampa Bay Buccaneers +11
- Green Bay Packers +10
Under-Achievers
- New York Giants -14
- Jacksonville Jaguars -12
- Atlanta Falcons -10
Stats of Note
- Highest No of Touchdowns: Tampa Bay Buccaneers with 57 (Projected = Kansas City Chiefs)
- Lowest No of Touchdowns: New York Giants with 22 (Projected = Detroit Lions / Houston Texans)
- No of Teams with 50 or more Touchdowns: 5 (Projected = 0)
- No of Teams with 30 or less Touchdowns: 6 (Projected = 0)
- Accuracy
- 25 teams projected within 8 (1 Touchdown per 2 games)
- 13 teams projected within 4 (1 Touchdown per 4 games)
- 1 team projected exactly
Takeaway
The process I use for these numbers is based on implied team totals from Vegas. Overall accuracy is pretty good but I’m going to look to make some tweaks to those assumptions for some of the high-flying, gun-slinging offenses, and for some of the basement dwellers who just don’t hit their projections. That said, if we go too extreme on projections and get it wrong then we’re going to increase the magnitude of the miss.
Touchdown Pass-Percentage
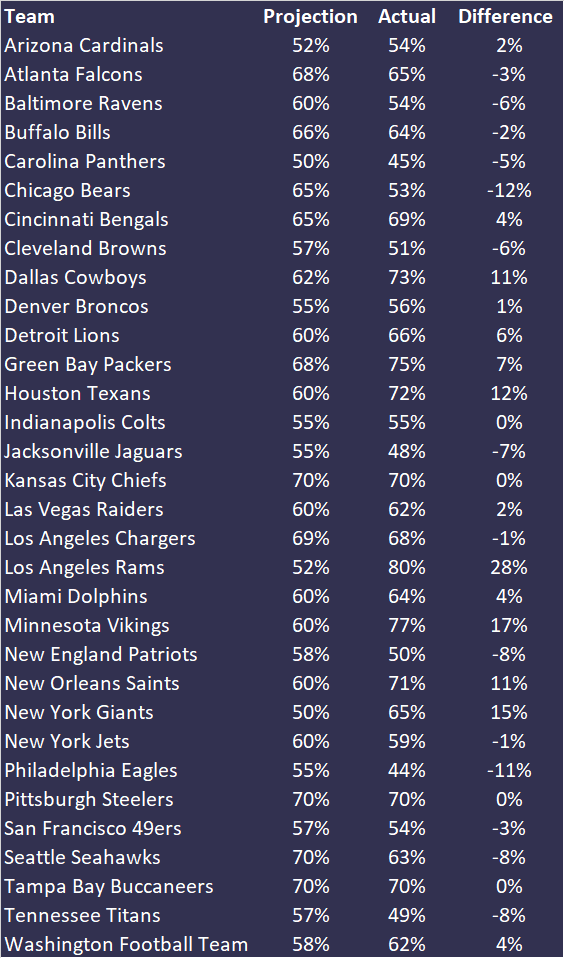
The LA Rams jump out straight away with a whopping 80-percent of their Touchdowns coming through the air. The shift to Stafford at Quarterback really has changed approach there and I didn’t go far enough in allowing for that.
The Minnesota Vikings jump in pass TD rate goes along with their unexpected pass play rate, while the New York Giants high rate was perhaps reflective of Saquon Barkley’s lack of impact in the ground game.
At the other end, the Chicago Bears run heavy approach led to a higher rate of rushing TDs and the Philadelphia Eagles clearly didn’t want Jalen Hurts to be throwing the ball too much in the second half of the season.
Stats of Note
- Highest Pass TD Rate: Los Angeles Rams with 80-percent (Projected = Kansas City, Pittsburgh, Seattle and Tampa Bay)
- Lowest Pass TD Rate: Philadelphia Eagles with 44-percent (Projected = New York Giants)
- No of Teams with 60-percent or more: 19 (Projected = 19)
- No of Teams with 50-percent or less: 5 (Projected = 1)
- Accuracy
- 16 teams projected within 5-percent
- 10 teams projected within 2-percent
- 4 teams projected exactly
Takeaway
Again, general accuracy isn’t too bad but even the run-heavy teams have a solid weighting towards passing Touchdowns. I’m going to look further at this in the offseason to see if there are any more learnings that can be applied for next season.
Summary
Overall, pre-season accuracy of team projections wasn’t too bad. There’s definitely some refining that can be done, particularly with scoring totals from Vegas. I’m also not going to over-react and over-correct when there’s some outlier performers, chances are they’ll regress somewhat towards the mean.
Keep an eye out for the next phases of my projections assessments and our updated projections guide and template.
RANKINGS | DYNASTY |
 Play DFS on Outlast now! Use promo code: YPF200 to receive a 100% deposit match up to $200!