

A Guide To Building Projections In 2021
He finished as RB4 on the season but only RB7 on a points-per-game basis; that other guy is coming back from injury so will eat in to the workload; this new coach has a tendency to throw the ball more; they drafted a top lineman so will be able to run the ball better…. does this all sound familiar and leave you with a conundrum on what to expect from players next year? That’s where projections come in.
The projections process can be a bit daunting but if you break it down in to some key parts and start with last year’s data as a baseline, then you’re already half way there.
A lot’s going to change between now and the start of the 2021 season (free agency, trades, the draft) but it’s a great time to get the process set up and review the 2020 numbers. That’s why we’re here.
Play Volume
What are we looking at?
Start at the top. How many plays is the team going to run? Teams have certain tendencies and offer a level of predictability in how many plays they’ll run. For example, Green Bay have established a reputation this season for using every second of the play clock on every play, which leads to less plays. They finished bottom 10 in total offensive plays run.
Why does it matter?
In 2020, the Houston Texans ran 890 offensive plays while the Los Angeles Chargers ran 1,093. That’s 200 more plays over the course of a season, or over 20-percent.
If we conservatively assume 5 yards per play then that could be 1,000 yards of offense, or 100 fantasy points rushing/receiving, not to mention catches in PPR formats. You better believe that’s going to make a difference to where players are going to rank.
What happened in 2020?
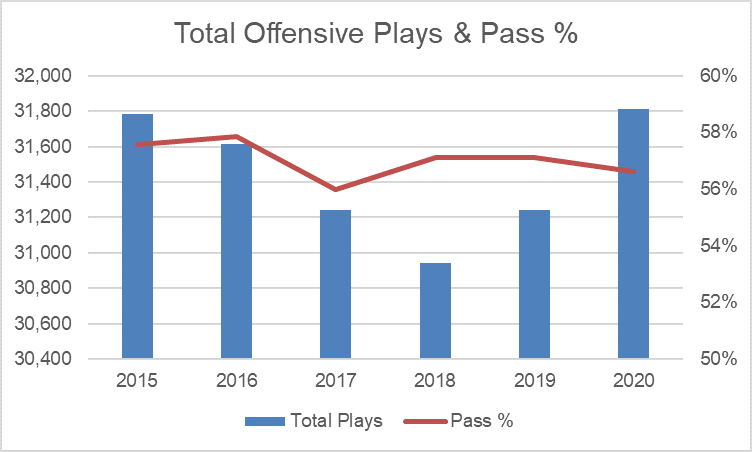
2020 saw a big jump on play volume across the league. As you can see from the chart above, there had been a steady decline through to 2018 and a small bounce back in 2019. That bounced even further in 2020, back above 2016 levels.

What about 2021?
Regression. A wonderful buzzword that the fantasy football community loves to argue about but it’s a simple statistical theory. If a particular statistic is much higher or lower than previous, the chances are it will regress back towards the mean. 2018 levels were way too low and unlikely to stay that way, and likewise 2020 levels appear to be on the higher side. I wouldn’t be regressing it back down to 2018 or 2019 levels but I would be projecting less plays in 2021.
Pass Ratio
What are we looking at?
Once we have the overall play volume, the next step is understanding how much of that volume goes through the air and how much is on the ground. These ratios may change in different circumstances and some teams have a clear strategy depending on the gamescript, while others will stick to the same plan regardless. The Jets, for example, rarely pass the ball more than 60-percent of the time despite being behind, whereas the Chiefs keep the ball moving through the air regardless of their lead.
Why does it matter?
Through weeks 1 to 16, Marquise Brown and DJ Chark received 92 targets and 94 targets respectively, with both Baltimore and Jacksonville having similar overall play volumes. However, with Baltimore throwing the ball only 42-percent of the time, it took a 25-percent target share for him to get there. On the other hand, with Jacksonville throwing 65-percent of the time it only took a 17-percent target share for Chark to hit the same number.
It’s important then to know what the team is doing with the ball to flush out how much opportunity there is through the air and on the ground.
What happened in 2020?
If you look again at the overall play volume chart above, you may notice that the passing ratio has been fairly stable across the league over the past few years, somewhere between 56 and 58-percent overall.

However, the individual teams ranged from 42-percent to 65-percent, that’s a big range. In 2019, it was a similar range and in 2018 it was between 44-percent and 67-percent. Over the 3 years, around 10 teams finish above 60-percent and 3 finish below 50-percent each season.
I’ll be highlighting individual teams in an upcoming series.
What about 2021?
Across the league we can probably expect some similar numbers but it’s the individual team tendencies that will need to be reviewed. Watch out for the changes in head coach and offensive coordinator to understand how their approach may change, and look at what major player movements tell us about team intent – for example, Buffalo’s signing of Stefon Diggs last offseason was a major indicator of them becoming more pass-heavy.
Touchdowns
What are we looking at?
Total touchdowns is the first part of this but then the split of passing touchdowns and rushing touchdowns is the next level to look at. The better the offense, the more touchdowns they are likely to score, it’s pretty logical. And understanding the split of passing and rushing touchdowns is exactly the same process as the play volume, if we project more rushing touchdowns then the running backs will get a bump.
Why does it matter?
Are you sitting down? Are you ready for this? Touchdowns = points. The Saints and Buccaneers scored the same number of touchdowns in the regular season, but Tampa scored 14 more through the air than New Orleans did. Which Quarterback do you want in that scenario?
What happened in 2020?
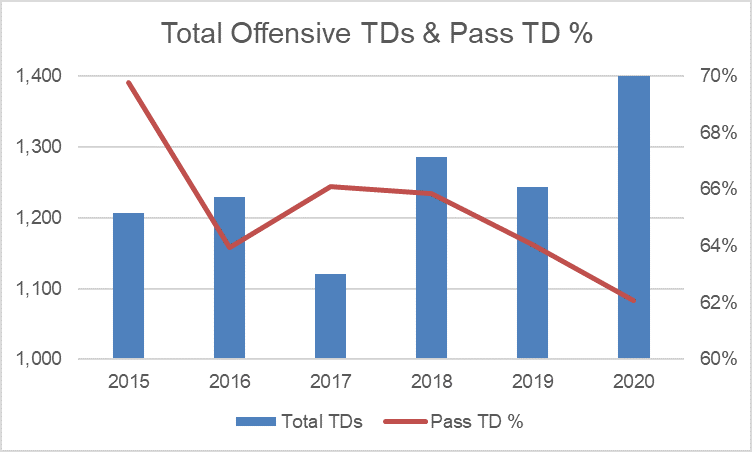
Look at those total touchdowns across the league in 2020. There’s been a level of relative consistency over the past 5 years with a small dip in 2017, and then 2020 went through the roof.
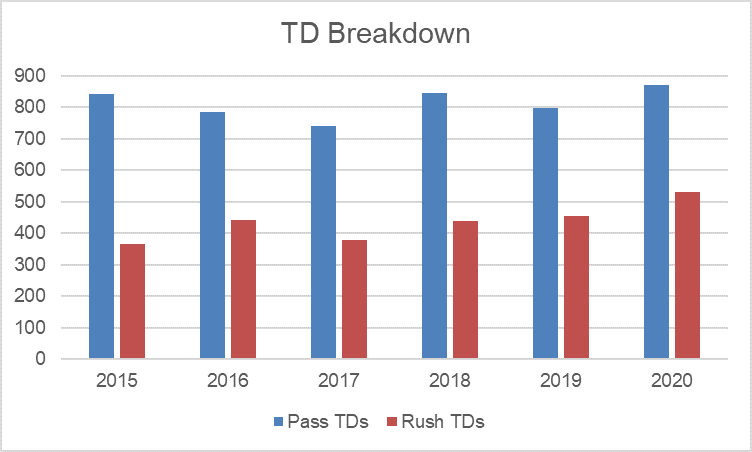
As for the split, well the ratio of passing touchdowns came down a touch but not significantly, and when you look at them side by side you can see that it was an uptick in rushing touchdowns that provided the biggest movement.
What about 2021?
Here’s that word again, regression. It’s not going to come all the way back to previous levels but I’ve no doubt that those numbers will drop somewhat in 2021.
Weekly Projections
When it comes to weekly touchdown projections during the season, I’m very much led by the Vegas implied totals which is calculated from the over/under and the spread. If you’re building a projections model I recommend building this calculation in to your sheet so you can see the implied team totals.
Here’s the calc: (Over/Under divided by 2) minus (spread divided by 2)
Example: If the game has an over/under of 50 and the spread is -4 (in favour of team A) then team A’s implied total is 25-(-2) = 27. Team B’s spread is +4 so their implied total is 25-(+2) = 23 (as a check, the team totals add up to the over/under of 50, and they are 4 points apart which matches the spread). If you get stuck with the +/- then remember that the team with a minus spread is the favourite and should end up with more points than the underdog!
You should then be looking to project your touchdowns within that implied total, remembering to consider the split between passing and rushing touchdowns. If the New York Jets have an implied total of 14 points then there’d be no point in projecting 5 touchdowns.
Now, two things that I consider here:
- Teams score field goals, extra points, and defensive points so a 27 point total isn’t likely to come entirely from passing and rushing touchdowns. On average, 72-percent of points scored across the league were from offensive touchdowns in 2020. Each team is different and it’s different week to week so it’s probably not accurate to apply wholesale, but you should consider it.
- This is a probability game. If you have the ability to foresee exactly who’s going to score the touchdowns for each team then I’ll meet you in Vegas. Otherwise, you need to have a method to put some projections against anyone who could score a TD without putting all your eggs in one basket and leaving others empty. My personal process is to apply a decimal probability to all of the players. For example, if I need to split 3 touchdowns across the Chiefs then I might give Tyreek 0.7, Kelce 0.8, running backs 1.2 and Mecole Hardman 0.3.
Market Share
What are we looking at?
Here’s where we convert the team projections in to the individual player projections. The target volume and rushing volume need to be attributed to the skill position players for each team. This is where we give 25-percent of the targets to Wide Receiver A and 60-percent of rushing attempts to Running Back B, for example.
How do we go about it?
Start with last year’s numbers, but don’t just take the final totals as that won’t tell you the full picture.
Cam Akers ended with 28-percent of the Rams rush attempts but he was the clear workhorse down the stretch and it’s fair to assume he’ll be taking more than 28-percent in 2021.
Kenny Golladay ended with 6-percent of the Lions targets but he missed most of the season with injury.
The context is important, and reviewing the team data across the season can provide much more insight in starting your process for next season.
Key Suggestions / Notes
- Set up your projections system so that you can apply a percentage to each player rather than manually trying to calculate it. It might take you some time to set up initially but will save a lot of time through the season
- Don’t forget the little guys. I know it’s tempting to assign all of Atlanta’s targets to Julio, Ridley, Gage, Hurst and Gurley but 15 different players got at least one target in 2020 and 27-percent of targets fell outside of those five. There are a number of ways you can address this depending on the level you want to go to, but don’t forget these peripheral players
- Make sure you look at rushing volume for the quarterbacks and other position players as well. If a team has 300 rush attempts, they won’t all be divvied amongst the running backs, there’ll be quarterback scrambles and designed runs, wide receiver jet sweeps, etc
Metrics
What are we looking at?
We now know how many targets or carries a player is going to get and how many touchdowns, but we need to know how many yards they’re going to get on those touches.
How do we go about it?
There are a few advanced stats for fantasy football we need as a minimum:
- Catch percentage for targets
- Yards per Target or Yards per Reception – either will work as long as you calculate it correctly
- Yards per Carry (calm down, I know there’s a ‘YPC is a bad stat’ movement but we’re not using it to make judgements on who is a good running back, we need it to generate the numbers!)
If you really want to go to town, you can go as deep as you want. You can look at aDOT (average depth of target), YAC (yards after catch), YBC (yards before catch), air yards, WOPR (weighted opportunity rating), and any other stat you can find data on. But be prepared that the more detail you go to, the longer it takes to put together your projections.
Key Suggestion
Spend the time setting up your projections template for the data that you can get access to and that you are comfortable understanding and projecting. Don’t go overboard on your first go.
Quarterbacks
This is the last position to look at and that’s because those other stats will drive 90-percent of the Quarterback’s numbers. If you have projected 500 team pass attempts, then the Quarterback has 500 attempts. When you’ve projected the wide receivers, each will have ended with a number of receptions and receiving yards – add them up and you get the pass attempts and passing yards for the quarterback. So let the rest of the team’s projections give you the Quarterback projection.
What you do need to do is apply yards per carry to their rush attempts and project their interceptions.
Wrap it all up
I’m not going to go through all the specifics on how to bring it all together but if you’re not sure stick to the basics:
- Targets x Catch-percentage x Yards per reception (or Targets x Yards per target) = receiving yards
- Rush attempts x Yards per carry = rushing yards
- Apply formulas to the yards, catches (for PPR formats) and touchdowns to give you fantasy points
- Have a summary sheet that pulls through all the players and their projected totals
If this is your first time doing projections, congratulations and good luck. You might be surprised in the outcomes.
Data
As for gathering the data, there are different sources available for different data with many sites providing parts of what you need and others having it spread out across their site. I’ve personally found that it’s time-consuming to jump around the different pages to understand the full picture, or a lot of work to pull together everything you need in one place.
Yards Per Fantasy now has a database of team data for 2020 that includes weekly stats for each player across all the key categories including target share, yards, aDOT, air yards, YAC, WOPR, and red zone usage for all players who received a target or a carry during the regular season, with the entire team’s data all on one page. Here’s a teaser:
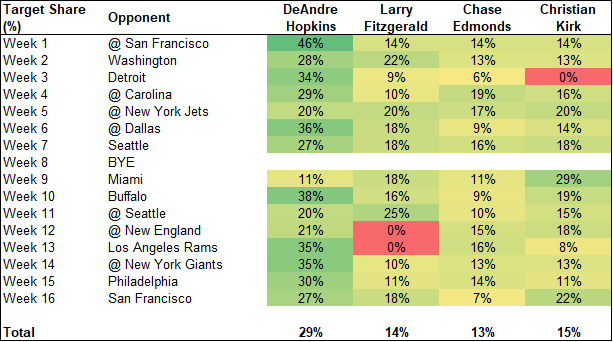
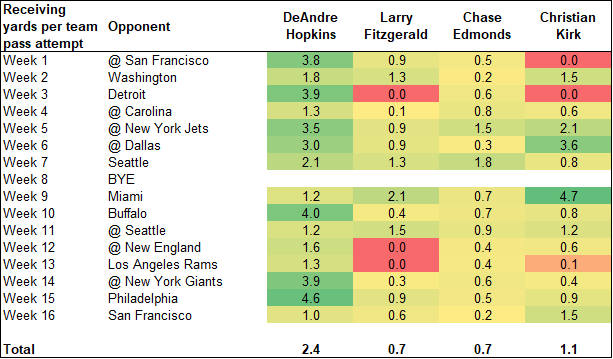
We’ve been doing the hard work so you don’t have to. This data is available on the Yards Per Fantasy team profiles with the ability to download a copy of all teams in one single database….for free!
And you can use the Yards Per Fantasy Projections Template to get started. There’s a simple free version or you can get the premium version with all the team data fully integrated and skill position players pre-populated.
Hit me up with any questions either on Twitter or through the Ask the Expert feature.