Week 8 Review: Looking Back At Projections
This week’s top random performers were:
- Drew Lock QB7
- Zack Moss RB2
- Curtis Samuel WR6
- Ross Dwelley TE7
Predicting these players can be a fools-errand most of the time but what we can do is understand the ‘why’ of what happened so that we have a better chance of predicting the ‘what’ next time around.
Check Out Our ALL-NEW Waiver Wire Rankings!
As always, I’m not going to spend time working through waiver wire adds, or buy low/sell high candidates, but instead I’m going to take a retrospective look at the assumptions I used for my weekly projections. I’ll pick out where I was significantly different, where I was close, and some of the players that sit at either end of some key stats on the week.
Let’s get into the Week 8 review.
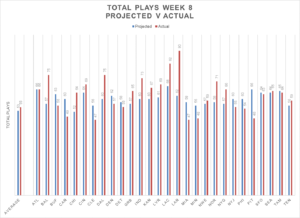
Week 8 Review: Team play counts
Key Stats
- Highest: LA Rams (92 plays)
- Lowest: Cleveland Browns (47 plays)
- Average: 63 plays
The Facts
- The Rams 92 plays is a feat that they haven’t achieved during the 21st Century at least
- Baltimore’s 79 plays is their highest of the season and higher than anything they managed in 2019
- Pittsburgh ran less than 50 plays for the first time with Ben under centre since week 1 2013
- Miami’s 48 plays is their lowest of the season so far, slowing things down with the rookie at the helm
- At the very bottom, Cleveland‘s play count is their lowest of the season so far
- 58-percent of teams are running more than 60 plays (for three weeks in a row now) and the average number of plays has been 62 or 63 every week since week 2 (2019 average was 61)
- 15 teams hit the over on their Vegas implied totals in week 8 and 68-percent (19 of 28) were within one score (up from 54-percent in week 7). 14 teams were within 5 points, 10 teams were within a field goal and Buffalo was perfect
- The Chargers are giving Dallas a run for their money with their season average now over 70 plays per game (Dallas are the highest with 71)
- Minnesota have now taken the crown as the team with the lowest average play volume away from Houston
The Results
- The average number of plays across the league was out by only 2 and 17 of 28 teams (61-percent) were within 10 plays (up by one from last week)
- 10 were within 5 plays, I was 1 out on 3 teams and the Falcons were a perfect hit
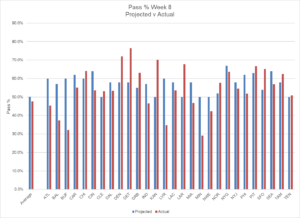
Week 8 Review: Pass Attempts
Key Stats
- Highest: LA Rams (61 attempts – 68-percent passing)
- Lowest: Minnesota Vikings (14 attempts – 29-percent passing)
- Average: 34 pass attempts
The Facts
- The Rams 61 pass attempts was 15 attempts higher than the next on the list. It helps when you run 92 plays
- Minnesota’s 29-percent pass rate is extremely low. The last time a team was lower than this was…Minnesota themselves in week 1 of 2019. Can probably blame the weather for this one
- Detroit had their highest pass rate of the season in week 7 with 63-percent and they topped it in week 8 with 76-percent. A philosophy change?
- Atlanta had their season-low passing rate (45-percent) but weather played a factor in the second half in particular
- The Weather was also a factor for Buffalo who only had a 32-percent pass rate and for Las Vegas with 35-percent
- 64-percent is the highest average pass rate for a team this season and that still belongs to Chicago. If you take out the games Trubisky started, that jumps all the way up to 69-percent
- The lowest average pass rate still belongs to Baltimore with 46-percent, with New England and Minnesota the only other teams below 50-percent
I’m going to keep this note here every week – this metric will always be gamescript driven so the trick is going to be getting that right. The reliance is still on the Vegas over/under and implied team totals to drive my projection totals so getting that right is going to help to get closer.
The Results
- 14 of 28 teams had a pass-ratio within 10-percent of projection (down from 23 last week)
- 9 were less than 5-percent off (down from 17); and 1 within 1-percent (down from 3)
- Closest hit was the Titan with 0.8-percent difference
- Biggest misses for the week were the Bills, Raiders and Vikings which were all the weather-affected games. I wound back my expectations based on the weather but clearly not far enough
Rush Attempts
Key Stats
- Highest: Baltimore (47 attempts)
- Lowest: Detroit (13 attempts)
- Average: 28 rush attempts
The Facts
- Only three teams had less than 20 rush attempts in week 9 (down from 5 in week 6 and 5 in week 5 but up from 2 in week 7)
- Chicago are still bottom 10 in rush attempts and have been basement dwellers in that category since Foles took over as QB
- Detroit’s 13 rush attempts is the first time they’ve been below 20 all season
- Previously run-heavy offenses like the 49ers and Broncos find themselves towards the bottom of the pile in a topsy-turvy week 8
Intended Air Yards per Attempt (IAY/A)
Key Stats
- Highest: Matt Ryan (12.9 yards per attempt)
- Lowest: Kirk Cousins (1.8 yards per attempt)
- Average: 7.6 Intended Air Yards per Attempt
The Facts
- This week’s non-QBs taking the top of the charts were Keenan Allen and Zach Pascal
- Matt Ryan has gone from the very bottom of the list in week 7 to the very top in week 8
- 1.8 air yards per attempt is low, even for Kirk Cousins. So not only did they hardly throw the ball but they might as well not have bothered when they did. Weather, what else can I say?
- I’m hesitant to raise more weather issues but Baker Mayfield didn’t have a good day in week 8 and his 5.4 air yards per attempt is his lowest of the season too
The Results
- 71-percent of QBs were within 2 yards of projection (up from 68-percent last week)
- 46-percent were within a yard (up from 43-percent)
- 6 QBs within 0.5 yards and only 0.1 yards off on Bridgewater, Tannehill and Brees
Targets
Top Targets
| 1 | Cooper Kupp | 21 |
| 2 | DK Metcalf | 15 |
| 3 | Alvin Kamara | 13 |
| 4 | Travis Kelce | 12 |
| = 4 | Davante Adams | 12 |
| = 4 | Michael Gallup | 12 |
Target Market Share (Percentage of Team’s Target Share)
| 1 | Stefon Diggs | 50 |
| 2 | Jarvis Landry | 44 |
| 3 | Jakobi Meyers | 43 |
| 4 | DK Metcalf | 42 |
| 5 | Braxton Berrios | 38 |
A few other notable receivers who saw double digit targets and around 30-percent market share:
- Brandon Aiyuk – 11 targets, 28-percent market share
- Keenan Allen – 11 targets, 27-percent market share
- Anthony Miller – 11 targets, 27-percent market share
- Corey Davis – 10 targets, 34-percent market share
- Julio Jones – 10 targets, 33-percent market share
Carries
Top Carries
| 1 | Josh Jacobs | 31 |
| 2 | Dalvin Cook | 30 |
| 3 | David Montgomery | 21 |
| 4 | Jordan Wilkins | 20 |
| 5 | Ezekiel Elliott | 19 |
Carry Market Share (Percentage of Team’s Carry Share)
| 1 | James Conner | 94 |
| 2 | David Montgomery | 91 |
| 3 | Josh Jacobs | 69 |
| = 4 | Jamaal Williams | 67 |
| = 4 | Le’Veon Bell | 67 |
Notable additions:
- DeeJay Dallas – 18 attempts, 64-percent market share as last man standing in Seattle
- Kareem Hunt – 64-percent market share but only 14 attempts
- Derrick Henry – 18 attempts but only 62-percent market share
- Jamycal Hasty – led the San Francisco backfield with 55-percent market share
Shout-out to Alfred Morris who got on the field for the first time since October last season and got himself 8 carries
Week 8 Review: Summary
- When Vegas get close with their implied team totals, we can get much closer with the volume projections
- The biggest swings this week were impacted by weather so need to get a better understanding of what this is going to do next time
- Most of the QBs have some predictability to them now
- Week 8 was a big week for number two receivers on their teams and the ‘1b’ receivers in those two receiver tandems (e.g. Cooper Kupp)
The trade deadline passed without a hitch so that should help with some predictability in the short term.
Be ready to adapt, be ready to learn from ‘why’ things happened, and be ready to adjust the ‘what’ for the next round of projections.
Now, how about that weather? We’re not in Kansas anymore Toto!


