
How To Build Football Projections In 2023
He finished as RB4 on the season but only RB7 on a points-per-game basis; that other guy is coming back from injury so will eat in to the workload; this new coach has a tendency to throw the ball more; they drafted a top lineman so will be able to run the ball better…. does this all sound familiar and leave you with a conundrum on what to expect from players next year? That’s where projections come in.
The projections process can be a bit daunting but if you break it down in to some key parts and start with last year’s data as a baseline, then you’re already half way there.
A lot’s going to change between now and the start of the 2023 season (trades, injuries, etc) but it’s a great time to get the process set up and review the 2022 numbers. That’s why we’re here.

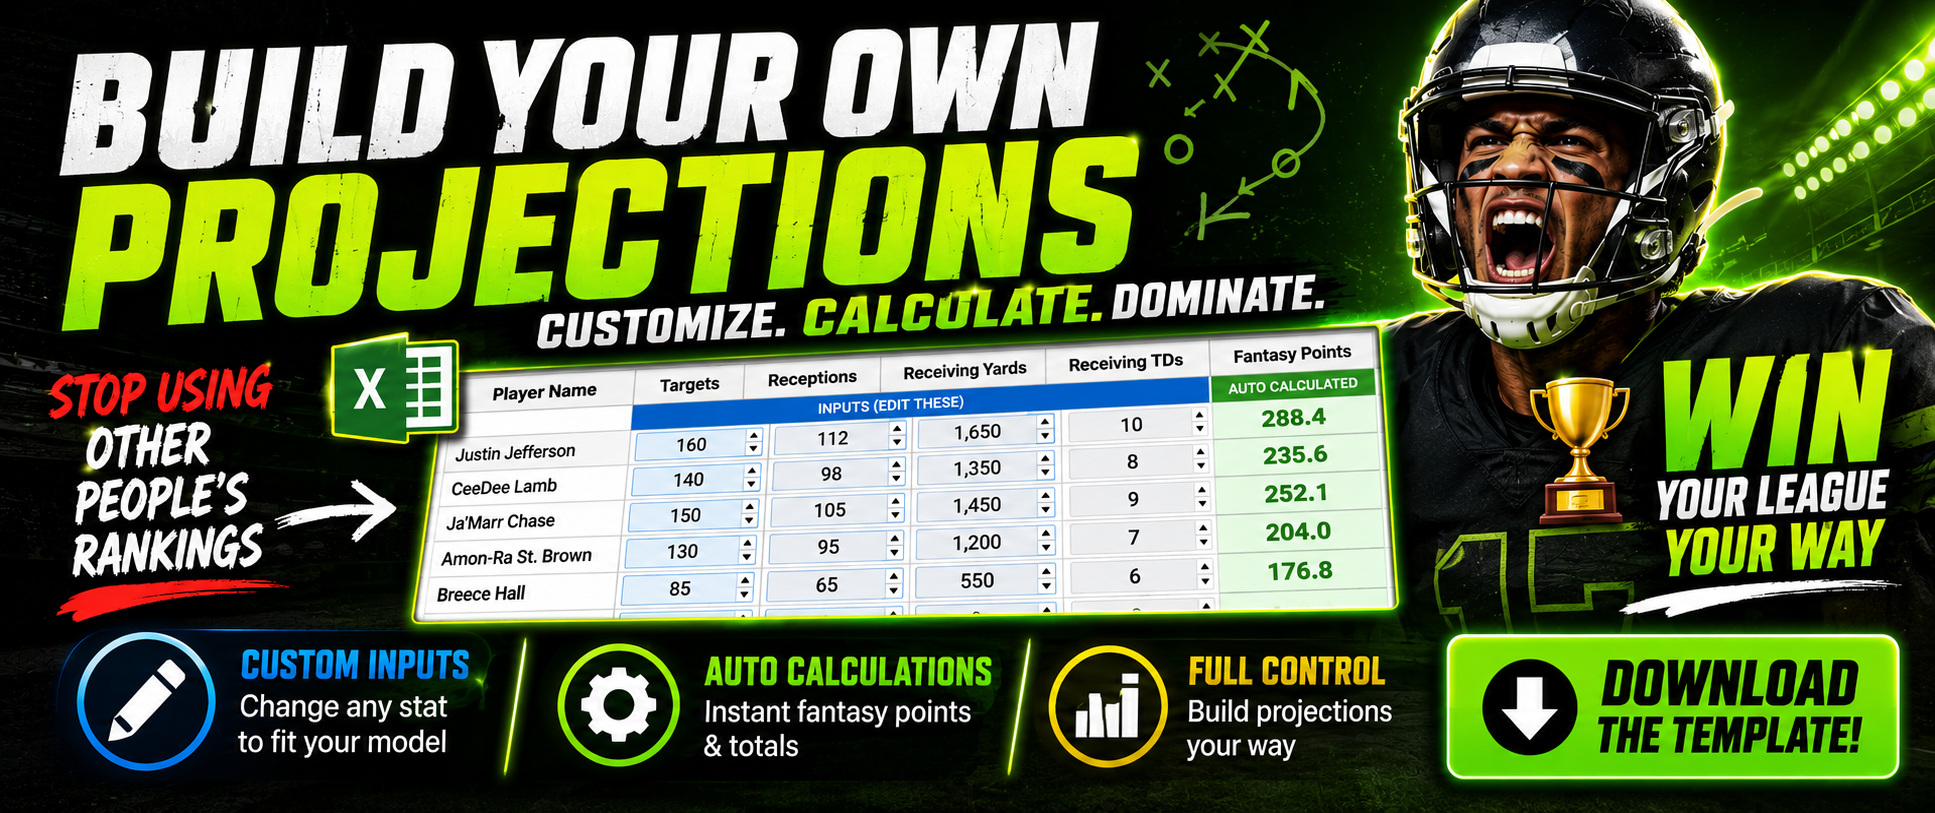
PROJECTIONS TEMPLATE – GET NOW!
Play Volume
What are we looking at?
Start at the top. How many plays is the team going to run? Teams have certain tendencies and offer a level of predictability in how many plays they’ll run. For example, the Miami Dolphins were last in the league in plays-per-minute on offense – they take their time in between plays and they finished bottom six in total offensive plays as a result.
Why does it matter?
In 2022, the Tampa Bay Buccaneers ran 1,159 offensive plays while the Carolina Panthers ran 976. That’s 183 more plays over the course of a season, or nearly 19-percent.
If we conservatively assume 5 yards per play then that could be 915 yards of offense, or 91.5 fantasy points rushing/receiving, not to mention catches in PPR formats. You better believe that’s going to make a difference to where players are going to rank.
What happened in 2022?
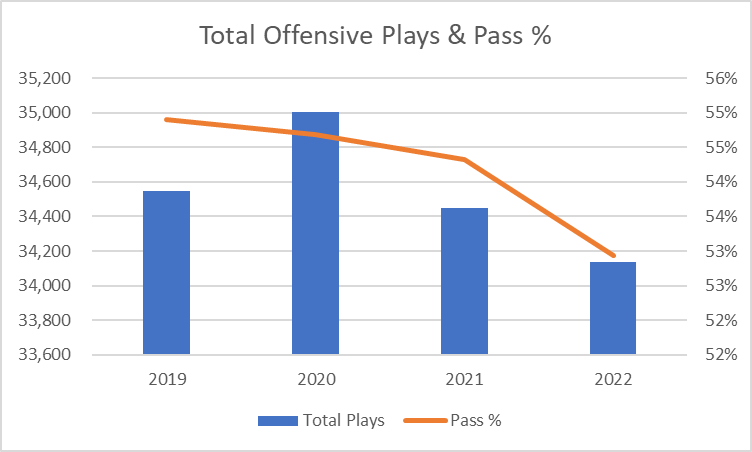
Note: 2019-2020 numbers have been normalised to a 17 game season for comparison with 2021 & 2022
Last year we noted that 2020 was a historical outlier and we’d returned to normal in 2021. However, we were expecting this to be fairly stable in 2022. Instead, the number of plays dropped further and the pass percentage went with it.

What about 2023?
2022 was a dip from the ‘normal’ range so it wouldn’t be unreasonable to project an increase for 2023 to bring it back up again.
Using the Yards Per Projections Template
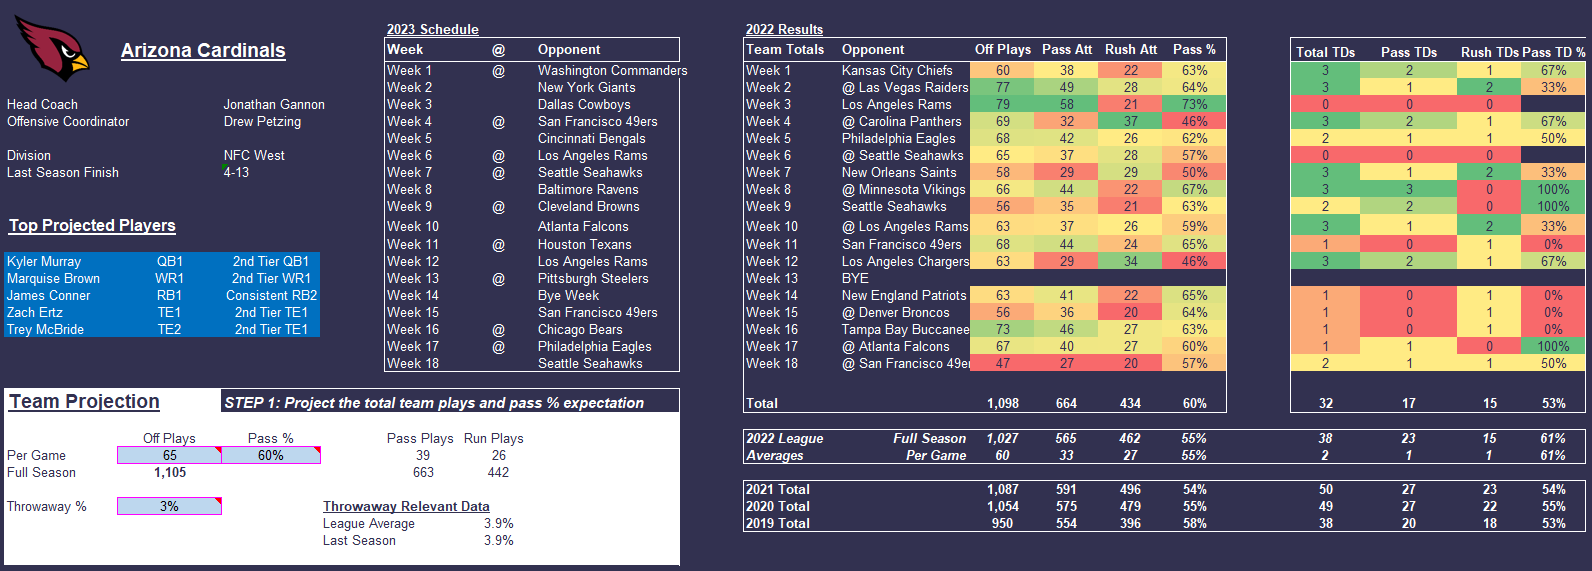
If you use the Yards Per Projections Template then all the info you need on play volume for each team is right at the top of the page. It has the schedule for 2023, the total plays per game of 2022 and the totals for the past 4 seasons. Take all that in and then simply complete the per-game projection in the white box on the left. While you’re at it, set the pass ratio percentage right next to it. Speaking of which….
Pass Ratio
What are we looking at?
Once we have the overall play volume, the next step is understanding how much of that volume goes through the air and how much is on the ground. These ratios may change in different circumstances and some teams have a clear strategy depending on the gamescript, while others will stick to the same plan regardless. The Falcons, for example, are the most run-heavy team in the league no matter what the gamescript is, whereas the Buccaneers keep slinging that ball at the highest rate in the league even if they’re ahead.
Why does it matter?
Drake London received a 28-percent target share for Atlanta in 2022, while Chris Godwin received just 19-percent of Tampa Bay’s targets – so you want the Drake London target volume right? Wrong.

28-percent of Atlanta’s pass attempts gave London 117 targets. Godwin’s 19-percent of Tampa Bay’s targets was 142 targets, an extra 25 targets.
It’s important then to know what the team is doing with the ball to flush out how much opportunity there is through the air and on the ground.
What happened in 2022?
If you look again at the overall play volume chart above, you may notice that the passing ratio has been fairly stable across the league over the past few years, somewhere between 53 and 55-percent overall.
However, the individual teams ranged from 40-percent to 66-percent in 2022, that’s a huge range. In 2021, that range was 46-percent to 64-percent and in 2020 it was similar again. Over the last 4 years, 4-5 teams finished above 60-percent and 4-5 finished below 50-percent each season.
What about 2023?
Across the league we can probably expect some similar numbers but it’s the individual team tendencies that will need to be reviewed. Watch out for the changes in head coach and offensive coordinator to understand how their approach may change, and look at what major player movements tell us about team intent – the Baltimore Ravens for example have hired a new OC and all signs point to more passing. On the flipside, the Indianapolis Colts drafted a running Quarterback which is going to push their overall play tendencies towards a lower passing rate.
And don’t forget to think about league-wide tendencies. In the last couple of years, the two-high defense pushed offenses to look more at short and intermediate passing. With more mobile Quarterbacks taking hold of the league, what will defenses do to stop that and what spaces does that in turn give for OCs to exploit?
Touchdowns
What are we looking at?
Total touchdowns is the first part of this but then the split of passing touchdowns and rushing touchdowns is the next level to look at. The better the offense, the more touchdowns they are likely to score, it’s pretty logical. And understanding the split of passing and rushing touchdowns is exactly the same process as the play volume, if we project more rushing touchdowns then the running backs will get a bump.
Why does it matter?
Are you sitting down? Are you ready for this? Touchdowns = points. The Buccaneers and Patriots scored the same number of touchdowns in the regular season, but Tampa Bay scored 6 more through the air than New England did. Which Quarterback do you want in that scenario?
What happened in 2022
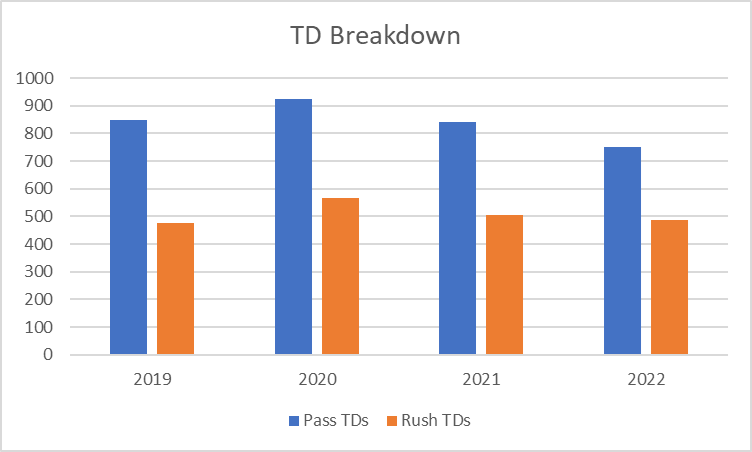
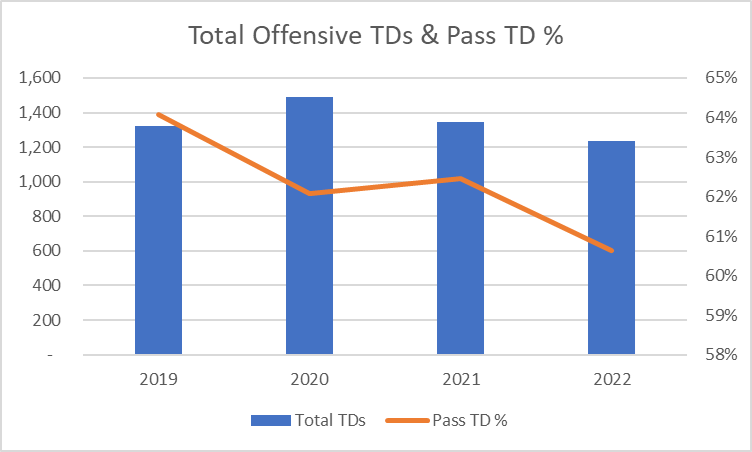
Note: 2019-2020 numbers have been normalised to a 17 game season for comparison with 2021 & 2022
Like with overall play volume, 2021 dropped down to ‘normal’ from an especially high 2020. But then 2022 dropped even further.
As for the split, rushing touchdown volume didn’t move much but passing touchdowns were well down which drove down that passing touchdown percentage. This could very well have been a reaction to the defenses playing more two-high to prevent explosive plays.
What about 2023?
Offensive Coordinators up and down the league will be spending the offseason scheming to get around this problem and history tells us that 2022’s numbers were low. This all points to expecting an increase in 2023.
Using the Yards Per Projections Template
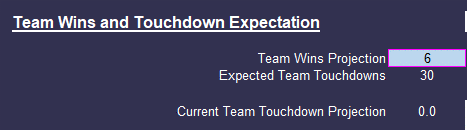
If you populate your expectation of team wins (personally, I use Vegas over/under) it will give you a rough expectation of how many touchdowns the team will score. As you populate your individual player projections, the Current Team Touchdown Projection will update and you can see if you’re somewhere in the same ball park.
Weekly Projections
When it comes to weekly touchdown projections during the season, I’m very much led by the Vegas implied totals which is calculated from the over/under and the spread. If you’re building a projections model I recommend building this calculation in to your sheet so you can see the implied team totals.
Here’s the calc: (Over/Under divided by 2) minus (spread divided by 2)
Example: If the game has an over/under of 50 and the spread is -4 (in favour of team A) then team A’s implied total is 25-(-2) = 27. Team B’s spread is +4 so their implied total is 25-(+2) = 23 (as a check, the team totals add up to the over/under of 50, and they are 4 points apart which matches the spread). If you get stuck with the +/- then remember that the team with a minus spread is the favorite and should end up with more points than the underdog!
You should then be looking to project your touchdowns within that implied total, remembering to consider the split between passing and rushing touchdowns. If the New York Jets have an implied total of 14 points then there’d be no point in projecting 5 touchdowns.
Now, two things that I consider here:
- Teams score field goals, extra points, and defensive points so a 27 point total isn’t likely to come entirely from passing and rushing touchdowns. On average, 63-percent of points scored across the league were from offensive touchdowns in 2022. Each team is different and it’s different week to week so it’s probably not accurate to apply wholesale, but you should consider it.
- This is a probability game. If you have the ability to foresee exactly who’s going to score the touchdowns for each team then I’ll meet you in Vegas. Otherwise, you need to have a method to put some projections against anyone who could score a TD without putting all your eggs in one basket and leaving others empty. My personal process is to apply a decimal probability to all of the players. For example, if I need to split 3 touchdowns across the Bengals then I might give Chase 0.7, Higgins 0.6, Mixon 1.0, Tyler Boyd 0.4 and the Tight Ends 0.3.
Market Share
What are we looking at?
Here’s where we convert the team projections in to the individual player projections. The target volume and rushing volume need to be attributed to the skill position players for each team. This is where we give 25-percent of the targets to Wide Receiver A and 60-percent of rushing attempts to Running Back B, for example.
How do we go about it?
Start with last year’s numbers, but don’t just take the final totals as that won’t tell you the full picture.
Ja’Marr Chase had 22-percent of the Bengals’ pass attempts in 2022 but he only played 12 games so it’s a fair assumption that a fully-fit Chase would eclipse that share.
The context is important, and reviewing the team data across the season can provide much more insight in starting your process for next season.
Key Suggestions / Notes
- Set up your projections system so that you can apply a percentage to each player rather than manually trying to calculate it. It might take you some time to set up initially but will save a lot of time through the season
- Don’t forget the little guys. I know it’s tempting to assign all of Cleveland’s targets to Cooper, Peoples-Jones, Chubb, Moore and Njoku but 15 different players got at least one target in 2022 and 6-percent of targets fell to Pharaoh Brown, Michael Woods, Anthony Schwartz, Demetric Felton and D’Ernest Johnson. There are a number of ways you can address this depending on the level you want to go to, but don’t forget these peripheral players
- Throwaways. The league average in 2022 was 4-percent of a team’s pass attempts that were thrown away, that’s 4-percent of targets that aren’t going to anyone. It differs across the quarterbacks though: Russell Wilson jumped from 3-percent to nearly 7-percent from 2021 to 2022, while Patrick Mahomes hovers around 4 to 5-percent every season. Jimmy Garoppolo on the other hand, had a 0.6-percent throwaway rate in 2022. Don’t forget to include these or you’ll over-project the receivers and the quarterback’s completion rate.
- Make sure you look at rushing volume for the quarterbacks and other position players as well. If a team has 300 rush attempts, they won’t all be divvied amongst the running backs, there’ll be quarterback scrambles and designed runs, wide receiver jet sweeps, etc
Using the Yards Per Projections Template
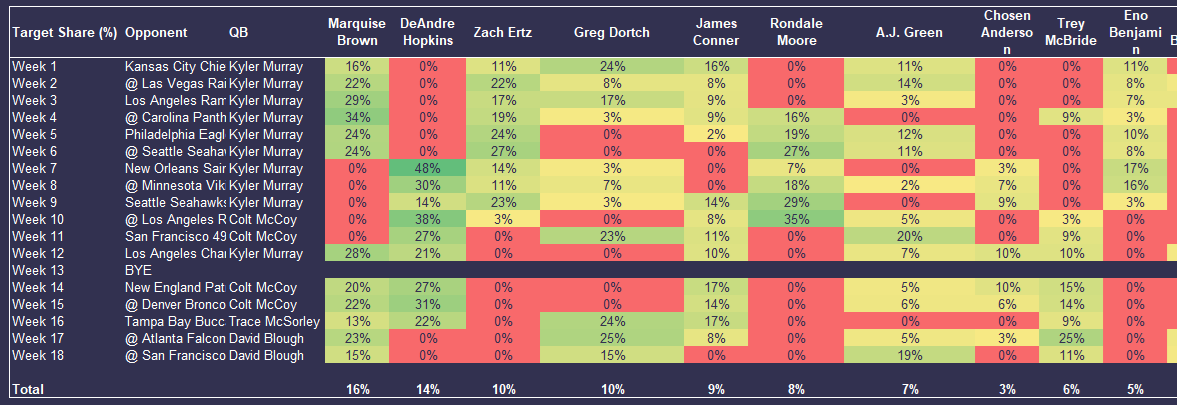
You could just use a player’s target share from the previous season but you lose all context. With the Yards Per template, you can scroll to the bottom of each team and see how players did on a weekly basis and how they performed when certain other players were also on the field.
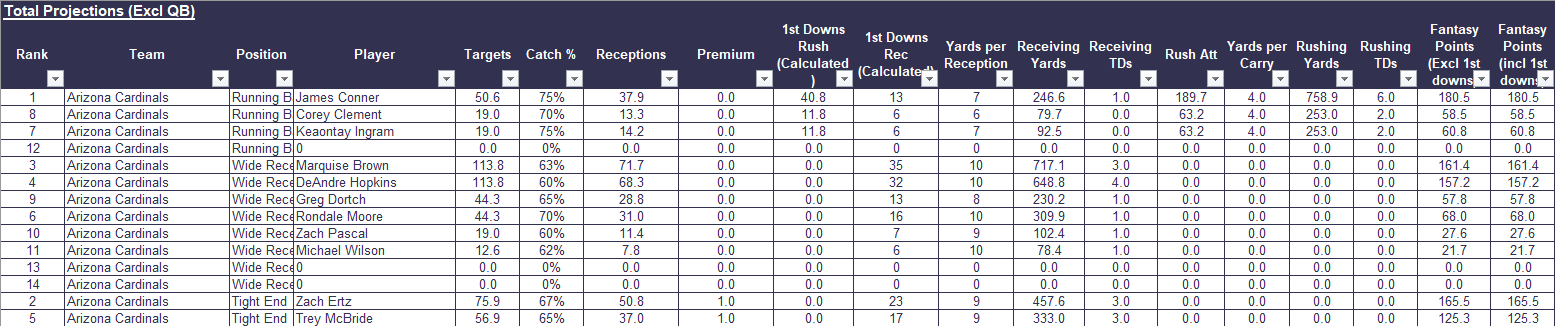
Take the above example of Arizona, Marquise Brown had a 16-percent target share and DeAndre Hopkins had 14-percent. But when you look at the games they actually played, their target shares were much greater than that. Refine that further by looking at the four weeks (weeks 12-16) where they were actually on the field together.
Metrics
What are we looking at?
We now know how many targets or carries a player is going to get and how many touchdowns, but we need to know how many yards they’re going to get on those touches.
How do we go about it?
There are a few advanced stats for fantasy football we need as a minimum:
- Catch percentage for targets
- Yards per Target or Yards per Reception – either will work as long as you calculate it correctly
- Yards per Carry (calm down, I know there’s a ‘YPC is a bad stat’ movement but we’re not using it to make judgements on who is a good running back, we need it to generate the numbers!)
If you really want to go to town, you can go as deep as you want. You can look at aDOT (average depth of target), YAC (yards after catch), YBC (yards before catch), air yards, WOPR (weighted opportunity rating), and any other stat you can find data on. But be prepared that the more detail you go to, the longer it takes to put together your projections.
Key Suggestion
Spend the time setting up your projections template for the data that you can get access to and that you are comfortable understanding and projecting. Don’t go overboard on your first go.
Using the Yards Per Projections Template
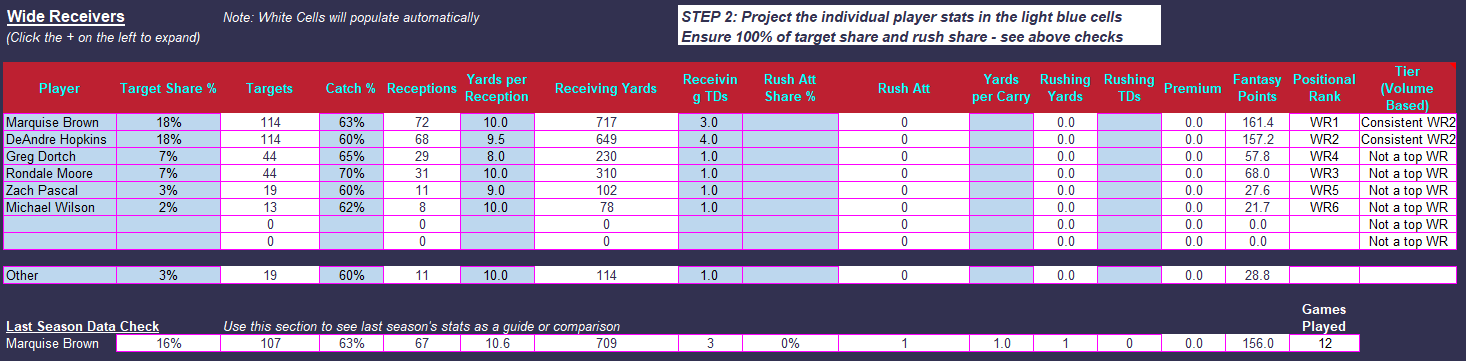
All set up and ready to go for you, simply populate the blue cells for your expectations and the file does the rest. The Last Season Data Check gives you a quick comparison for any player if you don’t want to dive in to the full game by game details at the bottom of the page.
Quarterbacks
This is the last position to look at and that’s because those other stats will drive 90-percent of the Quarterback’s numbers. If you have projected 500 team pass attempts, then the Quarterback has 500 attempts. When you’ve projected the wide receivers, each will have ended with a number of receptions and receiving yards – add them up and you get the pass attempts and passing yards for the quarterback. So let the rest of the team’s projections give you the Quarterback projection.
What you do need to do is apply yards per carry to their rush attempts and project their interceptions.
A step I find useful at this point is to look at the calculated Quarterback numbers (the passing yards, completion percentage, touchdown rate, etc) and compare them to previous data for those players. Putting in the receiver stats might make sense on their own but if it spits out a Quarterback completion percentage of 80-percent and 7,000 passing yards then something isn’t right and you’ll need to pull back those individual projections.
Wrap it all up
I’m not going to go through all the specifics on how to bring it all together but if you’re not sure stick to the basics:
- Targets x Catch-percentage x Yards per reception (or Targets x Yards per target) = receiving yards
- Rush attempts x Yards per carry = rushing yards
- Apply formulas to the yards, catches (for PPR formats) and touchdowns to give you fantasy points
- Have a summary sheet that pulls through all the players and their projected totals
If this is your first time doing projections, congratulations and good luck. You might be surprised in the outcomes.
Using the Yards Per Projections Template
The template has all the summaries all built in to give you total projections, rankings by position, exportable rankings, and a team output summary where you can look at your projections for the key players on any given team.
Range of Outcomes
Fundamental principle time. The results you get from your projections are based on your best estimate of the median outcome.
Remember, if you think you can correctly predict exactly how everything will play out in the NFL season then you need to let me know what time to meet you in Vegas. The reality is that there a lot of variables that are very hard to predict and subject to a lot of external factors. The result being that there are a range of outcomes for every player. Some players will have a fairly small range of outcomes (you know the ones, safe floor of guaranteed targets but they never blow the doors off) and others will have a huge range of outcomes from complete bust to league-winner (I’m not saying Anthony Richardson here but I’m not not saying it either…).
The point is, once you’ve completed your projections you need to give it a dose of reality check and think about the factors that could push those results in either direction. That will help you get a confidence level on your projections and on individual players.
And here’s a tip: when you’re looking at a player in later rounds and thinking about what would need to happen for them to hit the high-end of their outcomes, the less factors you can think of the better. Give me the player who only needs 1 thing to happen to hit his ceiling over the player that needs 5.
Data
As for gathering the data, there are different sources available for different data with many sites providing parts of what you need and others having it spread out across their site. I’ve personally found that it’s time-consuming to jump around the different pages to understand the full picture, or a lot of work to pull together everything you need in one place.
That’s why Yards Per Fantasy put together a database of team data for 2022 that includes weekly stats for each player across all the key categories including target share, yards, aDOT, air yards, YAC, WOPR, and red zone usage for all players who received a target or a carry during the regular season, with the entire team’s data all on one page.
We’ve been doing the hard work so you don’t have to.
And you can use the Yards Per Fantasy Projections Template to get started. We’ve been updating the document to make it as useable as possible and to put all the data you need right there at your fingertips. You’d be surprised how long it takes just to set up a document with all the teams and the formulas, not only does our template save you that time but it simplifies the whole process. When you’re done, you can automatically see your sorted rankings and can even spit out your top 12s in a ready-made graphic to post all over your social media.
Hit me up with any questions on Twitter.
Ready to Give It a Try?
PROJECTIONS TEMPLATE – GET NOW!
YOU’RE GETTING:
- NEW LOOK for 2023!
- Team-by-team 2022 data built in and league averages for comparison
- Players are pre-populated for you, saving hours of set up time!
- Ready to start making projections right now!
- Auto-generated rankings for each position in whatever setting you choose
- Allows a quick check of 2022 data for individual players right there where you’re projecting (no jumping between pages)
- Customizable scoring including Tight End Premium and points for first downs
- Expected team touchdowns
- Key offseason changes and “need-to-knows” are included for each team so you don’t have to do your own research
- Provides a volume based tier guide (eg consistent WR2, elite RB, etc)
- Range of Outcomes (to be added soon!)
- Create your own tiers within your rankings and use them while you draft
- Export rankings to show them off on social media
- Turn it into Weekly Projections during the season
- Video Tutorial