 Compete in Weekly Drafts & Player Props Contests! Use Promo-Code: YARDSPER for a 100% deposit match up to $100!
2021 Projections Review – Part 2: Quarterbacks
Prior to the 2021 fantasy football season kicking off, I completed my full team projections for every team based on my assumptions of what I thought was a likely outcome for the season. If you haven’t done projections before, I wrote an article last offseason on how to do it and Yards Per Fantasy has a projections template that you can use. Both the article and the template will be updated this offseason so watch this space.
I’m going to spend some time in the early part of the offseason working through my assumptions and comparing them to what played out. I’m not going to spin takes and try to justify whether I’m a genius or an idiot, I’m simply looking at the process and comparing it to the results so I can adjust moving forward.
For Part 2 of the series, I’m looking at Quarterbacks and I’m going to focus on the efficiency metrics – completion percentage, touchdown rate, yards per attempt, intended air yards per attempt, and rushing stats. For all but the rushing stats, they are not volume stats. I’m not looking at pass attempts, total yards or total touchdowns. Those are a product of two things: the team totals which I covered in Part 1 of this review series and the metrics that we’ll review in this article. If you work out those two things, the totals take care of themselves.
For the rushing stats, they are totals, but they are 16 game pace totals. Previous seasons were 16 games so if we want to be able to compare apples with apples, it’s appropriate to work it back to a 16 game pace for now.
Completion Percentage and Touchdown Rate

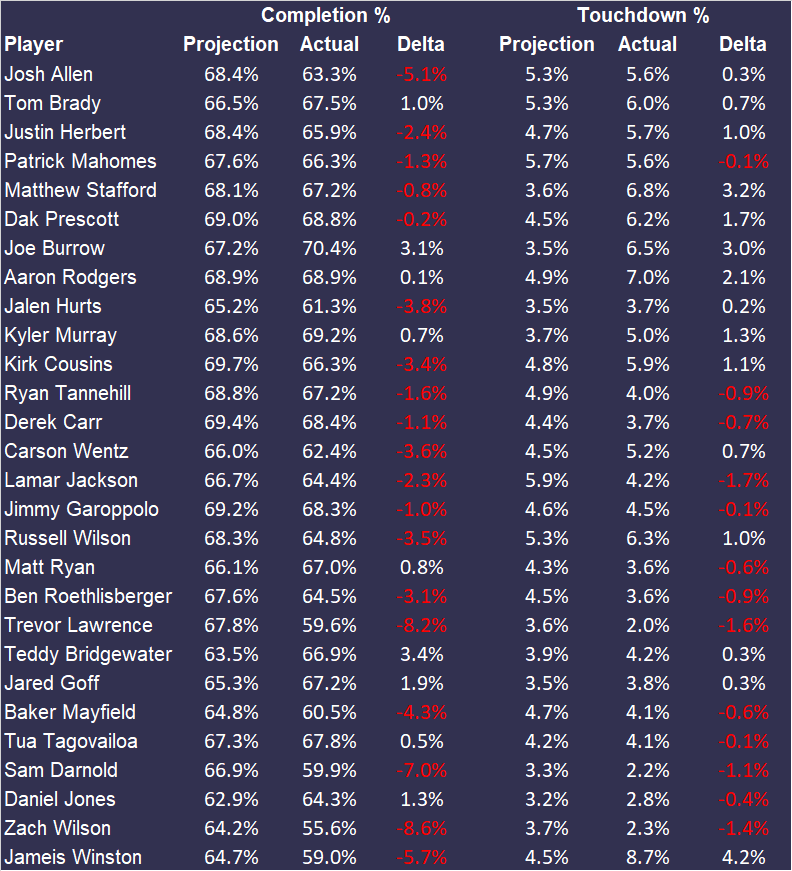
Straight away I can see a lot of red against completion percentages. I clearly over-projected a lot of Quarterbacks, some by only a small amount but some by a decent margin.
Josh Allen’s 3rd year jump in accuracy was, in hindsight, always unlikely to be sustainable. I did project his completion rate a little lower than his 2020 numbers but he actually ended up in the middle of 2019 and 2020.
Joe Burrow ended with a remarkably efficient season that I definitely didn’t see coming, while there were a number of Quarterbacks who just flat out failed to live up to expectations. Rookies Trevor Lawrence and Zach Wilson, Jalen Hurts and Baker Mayfield some of the notable ones.
Touchdown rates is somewhat linked to the team totals review but it’s worth looking at the outliers here to see those that could regress next season. Trevor Lawrence and Jameis Winston jump out for opposite reasons here.
Stats of Note
Note: Looking at the players in the table only
- Highest Completion percentage: Joe Burrow (Projected = Kirk Cousins)
- Lowest Completion percentage: Zach Wilson (Projected = Daniel Jones)
- Highest Touchdown rate: Jameis Winston (Projected = Lamar Jackson)
- Lowest Touchdown rate: Trevor Lawrence (Projected = Daniel Jones)
Accuracy
- 13/28 projected completion percentage within 2 percent
- 8/28 projected completion percentage within 1 percent
- 17/28 projected touchdown rate within 1 percent
- 7/28 projected touchdown rate within 0.5 percent
Takeaway
Regression, regression. Outlier performances from previous seasons come back towards the middle so I’m going to project Joe Burrow’s completion rate to come down in 2022 and Trevor Lawrence’s touchdown rate to go up.
Yards Per Attempt

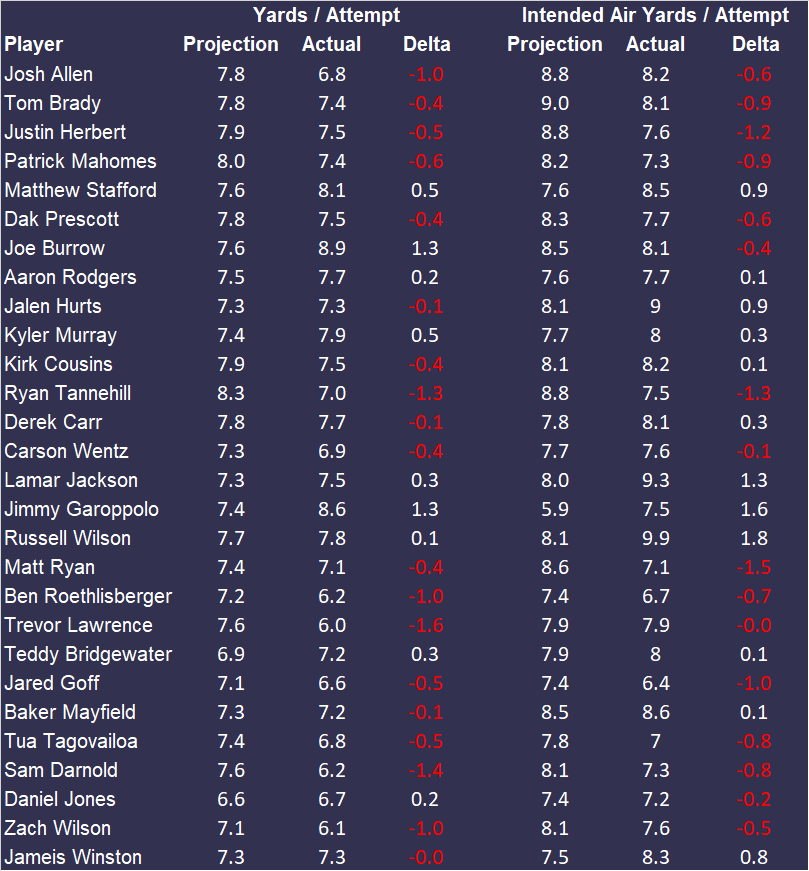
First note here is that yards per attempt doesn’t widely differ across the league. No-one in this list has a yards per attempt less than 6 and only three players are over 8. Matthew Stafford, Joe Burrow and (checks notes) Jimmy Garoppolo were the players to get over the magical number 8.
Intended air yards per attempt is always an interesting metric to monitor. Whilst actual yards per attempt is influenced by whether the receiver catches the ball and what he does with it after he does, intended air yards is purely how far they are throwing it every time. A few players caught me out here. The aforementioned Jimmy G along with Lamar Jackson and Russell Wilson were slinging it further than expected, while Justin Herbert jumps out with his shorter than expected outcome.
Stats of Note
- Highest Yards per Attempt: Joe Burrow (Projected = Ryan Tannehill)
- Lowest Yards per Attempt: Trevor Lawrence (Projected = Daniel Jones)
- Highest Intended Air Yards per Attempt: Russell Wilson (Projected = Tom Brady)
- Lowest Intended Air Yards per Attempt: Tua Tagovailoa (Projected = Jimmy Garoppolo)
Accuracy
- 23/28 projected Yards per Attempt within 1 yard
- 19/28 projected Yards per Attempt within 0.5 yards
- 1 perfect
- 22/28 projected IAY/Attempt within 1 yard
- 11/28 projected IAY/Attempt within 0.5 yards
- 1 perfect
Takeaway
We’re building a story now. We saw Joe Burrow overachieving on the completion and touchdown metrics, and we’re seeing the same on the yardage metrics. It’s no wonder the Bengals have had such a good season but it’s continuing to scream regression at me for 2022. Similarly, Trevor Lawrence is once again propping up the yards per attempt after underperforming in completion and touchdown metrics. I’m going to be looking long and hard at these two when I project 2022 for the exact opposite reasons.
Rushing

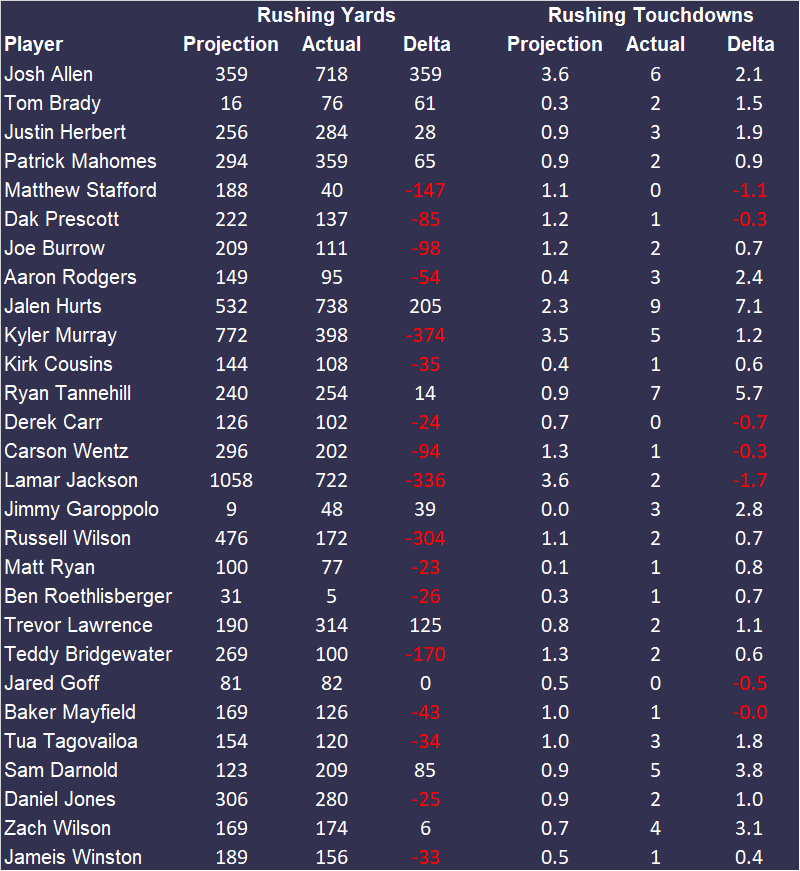
Holy Josh Allen! He had been gradually winding back his rushing yards over the past three seasons, in conjunction with his increased passing prowess. I was backing that to continue somewhat and boy was I wrong as he produced his biggest rushing season of his NFL career so far.
The other underestimate was Jalen Hurts. I knew he was going to run the ball a lot but we only had a small sample size to work off and I clearly undercooked this one.
On the flipside, most of the overestimates come down to injuries to the likes of Lamar Jackson and Kyler Murray, while Matthew Stafford apparently forgot how to run. Looking back now, my projection for Stafford assumed that he’d be more mobile than he’s ever really been. That said, I would never have projected him to have his lowest total since 2010.
When it comes to rushing touchdowns, I think I’ve got some work to do on my projections. These tie back to the team totals again which I noted a number of over-achievers, but I clearly undercooked some of these.
Stats of Note
- Highest Rushing Yards: Jalen Hurts (Projected = Lamar Jackson)
- Lowest Rushing Yards: Ben Roethlisberger (Projected = Jimmy Garoppolo)
- Highest Rushing Touchdowns: Ryan Tannehill (Projected = Josh Allen / Lamar Jackson)
- Lowest Rushing Touchdowns: Stafford / Carr / Goff (Projected = Jimmy Garoppolo)
Accuracy
- 22/28 projected rushing yards within 160 yards (10 yards / game)
- 16/28 projected rushing yards within 80 yards (5 yards / game)
- 21/28 projected rushing touchdowns within 2
- 14/28 projected rushing touchdowns within 1
- 1 perfect
Takeaway
This category needs some more work this offseason. There’s definitely some impact from the running backs on those teams so we need to think about the impact of potential injuries or whether the QB is their team’s best bet when it comes to the red zone.
Summary
There’s definitely plenty to learn from our Quarterback projections. A lot of the Quarterback projections are worked out automatically from the team totals and skill position players but each one needs extra focus to whether those outputs make sense.
The two overriding thoughts in my mind from this exercise
- Need to rely less on the skill position player projections driving the QB projection, and increase the influence of the QB on the numbers
- Regression, regression, regression. I’m looking at you Joe Burrow and I’m looking at you Trevor Lawrence
Keep an eye out for the next phases of my projections assessments and our updated projections guide and template.
RANKINGS | DYNASTY |
 Play DFS on Outlast now! Use promo code: YPF200 to receive a 100% deposit match up to $200!


