Those who have followed my writing throughout the 2020 season will know that I’m a projections guy, I released weekly content highlighting key facts and stats about play volume, pass/rush tendencies, Vegas lines, target leaders, etc – my Projections Retrospective.
Now that 2020 has drawn to a close, I’ll be spending some time reviewing the total season numbers. The goal, to be more informed about what each team did so we can better project how they’ll tackle 2021 (subject of course to coaching and personnel changes over the offseason).
If you missed it, check out my Projections Guide where I looked at some of the key league-wide numbers for 2020 and stepped through how to create your own projections.
Let’s dive in to the AFC West.
Kansas City Chiefs
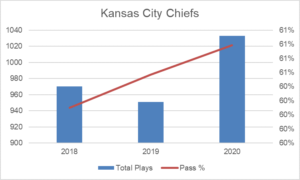
A significant jump in 2020 for the Chiefs in overall play volume with the 6th most offensive plays in the league after being bottom 10 in 2019. I suspect the real story is somewhere in between. As for passing ratio, the graph is a little misleading with the difference between 2018 and 2020 only 1-percent.
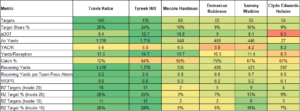
It’s a predominantly two-pronged receiving attack as you’d expect but Hardman, Robinson and Watkins all had games with significant target share. The roles in the offense are clear when you look at aDOT (average depth of target), Kelce comes short, Hill goes long and the rest of the guys float somewhere in the middle. Kelce’s numbers are worthy of a top wide receiver with his air yards better than many teams’ WR1, a number which is blown out of the water by Hill’s air yards. A look at Kelce and Hill’s Receiving Yards per Team Pass Attempt quickly confirms their dominance in this offense.
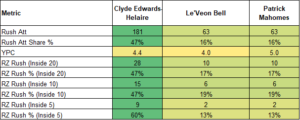
On the surface CEH looks like the dominant back but this was anything but consistent across the season. In the first six games (before the Le’Veon Bell signing), he received 15+ carries four times. He only hit that threshold once after that, and only just. His red zone usage also took a decline but that was less about other players taking carries and more about a reduced tendency to run the ball at all down there.
Key Takeaway: When you have a guy like Patrick Mahomes under centre, you have to assume that they’ll let him do his thing and throw the ball regardless of gamescript. That’s good news for the pass-catchers but far less exciting for the running backs.
Las Vegas Raiders
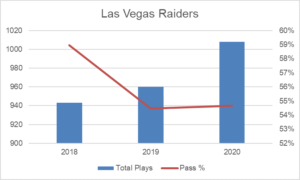
A gradual increase in play volume over the past few years as the Raiders establish themselves as a stronger team and win more games. Passing ratio was similar to 2019 as they heavily utilise Josh Jacobs and the run game.
It’s the Darren Waller show in Las Vegas but don’t be deceived by some of the other stats. Agholor actually had a 21-percent target share after their bye and had some dominant performances in air yards and receiving yards per team pass attempt. Ruggs’ role was clear too, a smattering of deep shots per game and that’s it.
A dominant look here for Jacobs and if you remove the game he missed, his carry share goes above 60-percent. On the flip side, there was a four week spell in the middle of the season where Booker garnered over 30-percent of the carries. Regardless, when the ball is down in the red zone, it’s all about Jacobs and that gives him tremendous touchdown upside.
Key Takeaway: Establish the run is the Raiders’ first priority, then it’s get the ball to Waller. They’re still clearly looking for field stretching but unless they can get a bit more creative with Ruggs then they’re going to be much easier to defend.
Los Angeles Chargers
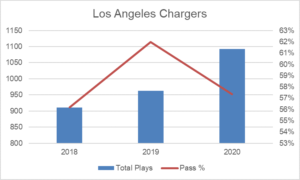
The Chargers had the highest play total in the league by some margin, and a massive bump from their 2018 and 2019 levels. Of note here though is the number of close shoot-out games that they got in to and three games that went in to Overtime. This will come back down somewhat in 2021.
For passing rate, they were a pass-heavy team but the week-to-week ratio’s were all over the place with six games over 60-percent.
The Chargers are one of the teams with a big difference between the percentage of air yards to their wide receivers (81-percent) and targets (54-percent), as Keenan Allen operates in the ‘Tight End’ area with Hunter Henry and the three outside receivers go deep. In the case of Tyron Johnson, REALLY deep. Austin Ekeler’s target share is impacted by missed time and looks more like 17-percent if you exclude those missed games. In the red zone it’s Allen, Henry and Williams who are trusted to do the business.
This is another picture of a spread workload that wasn’t really a spread workload. If you remove the games that Ekeler missed then he had 45-percent of the carries, look at the games after Ekeler returned from injury (i.e. don’t include the first few weeks before his injury) and he’s up at 53-percent. Perhaps the most reflective period of time, if you look at weeks 14-16 then Ekeler had 51-percent of the carries to 25-percent from Ballage.
Red zone usage was a bit of a free-for-all but Ekeler only had one carry inside the 5 all season and that was when Ballage was out. Justin Jackson didn’t get a single one.
Key Takeaway: Outside of Keenan Allen there’s not a lot of reliable volume in the passing game. They like to air it out deep though and that creates some DFS opportunities or WR3 upside in any given week. As for the backs, there’s clearly a desire to support Ekeler and keep him out of danger in the red zone.
Denver Broncos
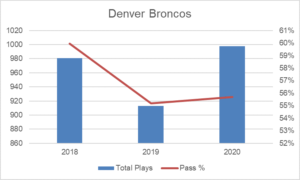
The 2020 play total would have been even higher if not for the ‘Kendall Hinton’ game, a significant increase on 2019 but only a modest increase on 2018. Another example of regression after a big swing in a previous year. The passing ratio was fairly stable but the Broncos went through phases during the season, starting off throwing more and reverting back to it in the middle of the season before dropping back in to the run game again.
An ugly spread of the volume in a team that, on the face of it, had several interchangeable wide receivers who all got the same kinds of targets. A quick look at the aDOT (average depth of target) across the board shows a real lack of variety in the depth of throws to those receivers, allowing the Tight Ends to take the shorter throws and the running backs limited to dump offs behind the line of scrimmage. Jeudy’s volume statistics are the most intriguing but with a terrible catch percentage, it never amounted to anything. Don’t forget about Albert O in 2021, he got injured just as he was starting to get in to a rhythm.
Outside of injuries, it was a much closer split between Gordon and Lindsay with neither really offering much dominance. Gordon was the red zone back though, that much is clear.


