Those who have followed my writing throughout the 2020 season will know that I’m a projections guy, I released weekly content highlighting key facts and stats about play volume, pass/rush tendencies, Vegas lines, target leaders, etc – my Projections Retrospective.
Now that 2020 has drawn to a close, I’ll be spending some time reviewing the total season numbers. The goal, to be more informed about what each team did so we can better project how they’ll tackle 2021 (subject of course to coaching and personnel changes over the offseason).
If you missed it, check out my Projections Guide where I looked at some of the key league-wide numbers for 2020 and stepped through how to create your own projections.
Let’s dive in to the AFC North.
Pittsburgh Steelers
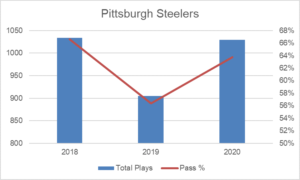
As suspected, 2019 was an outlier for the Steelers as they cycled between Mason Rudolph and Devlin Hodges at Quarterback. 2020 saw the return of Big Ben with a return to high play volume and a heavy passing ratio.
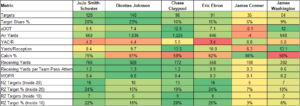
62 yards was all that separated the three lead receivers on the season, but that doesn’t tell the full story. Claypool had almost twice as many air yards as Juju who had the lowest aDOT (average depth of target) and YAC/R (yards after catch per reception) of the group. The running backs were also a complete non-factor in the passing game throughout the season.
Outside of week 1 (the ‘what’s happened to James Conner’ game) and a timeshare in week 16, Conner was the lead back when active, with Snell only receiving more than 20-percent of carries twice. But over the back end of the season, Snell was the redzone back. Conner did miss some time during this spell but even when active, Snell was still the guy they went to in those situations. The statue of Big Ben plays next to no part in the run game.
Key Takeaway: Consider the types of targets that players get, not all volume is equal. JuJu played a short-area role and while the target volume was good, the Chase Claypool targets were much more valuable.
Cleveland Browns
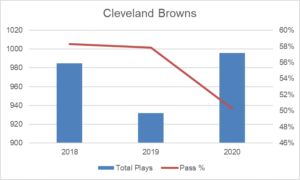
Overall play volume has bounced back after an especially low year in 2019 where they were bottom 6 in offensive plays. With Kevin Stefanski at the helm with the Minnesota rushing background and a more potent offense, the play volume jumped up and the passing ratio came plummeting down, leading to an additional 100 rush attempts in 2020.
On the face of it, the receiving stats show a spread out distribution with Jarvis Landry leading the way and five other players getting between 38 and 65 targets. However, when you scratch the surface you start to see the pre and post OBJ parts of the season. Through the first six games, OBJ dominated the targets and the air yards, although didn’t turn them in to significantly more production than Landry did in that period. After Beckham’s injury, it was Higgins who took over those targets but with a much better catch-percentage he was able to do a little more with them.
Cleveland’s wide receiver room only received 53-percent of targets but accounted for 73-percent of the air yards. It was a lot of short volume to tight ends and running backs, with big shots to the wide receivers.
Interestingly, only twice did Cleveland have a player get over 100 receiving yards in a game (Higgins in week 7 and Landry in week 12).
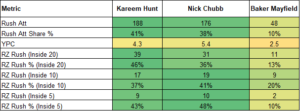
The split here is largely down to the time that Chubb missed, if you take out those games then Chubb starts to show a bigger portion of that rushing pie. Hunt still took a lot of work from Chubb when they were both available but from week 14 onwards that changed and Hunt did not receive double-digit carries in a game after that. The red zone usage is equally enlightening with Nick Chubb only getting signficant work in one game prior to his injury but dominating the red zone down the stretch.
Key Takeaway: Run, run and run some more, that’s Cleveland’s identity. The passing volume increased through the year but you’re not going to get a WR1 from this team. If Chubb can start 2021 how he finished 2020 then he’ll be an RB1.
Baltimore Ravens
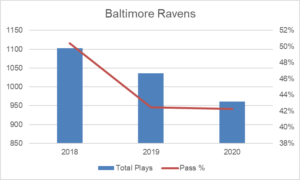
It looks like a decline in overall play volume but it’s not a significant one year to year, with the drop from 2019 to 2020 equating to less than 5 plays per game. The important part of this is the passing ratio with Baltimore’s 42-percent the lowest in the league and one of only three teams below 50-percent (New England and Tennessee the others).
This is a concentrated passing game that runs through Mark Andrews and Marquise Brown. There was however a four week spell in the middle of the season where Willie Snead became relevant and that coincided with Mark Andrews having a shorter aDOT and less yards to show for it, before the Ravens remembered who their best players were. Brown is the deep threat/air yards guy and Mark Andrews is the man in the red zone.
Baltimore’s RB1 is their QB1, we know that already and the numbers show it. Their rushing splits should really be assessed in two parts, before the bye and after it. Before the bye, Mark Ingram was the main running back before disappearing and handing the reigns to JK Dobbins after the bye.
Don’t be fooled though, Gus Edwards and Lamar still had a big share of the pie every single week and there were only three times all season where a running back had more than 40-percent of the carries. It’s a free-for-all in the red zone too and although Dobbins did get more opportunity down the stretch, Edwards and Lamar didn’t go away.
Key Takeaway: There are no elite fantasy options in this team but there are plenty of good ones. Their reliance on the run, much like Cleveland, leaves the receiving options needing touchdowns to produce fantasy returns. Dobbins will no doubt be the lead back but don’t expect top returns unless the Ravens make major changes to the way they play.
Cincinnati Bengals
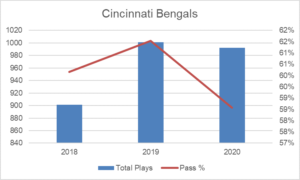
A new coach in 2019 with a change in play volume that maintained it’s course in 2020. Likewise, the passing ratio only took a slight dip in percentage as their rookie Quarterback used the running game to take the pressure off in early parts of the season.
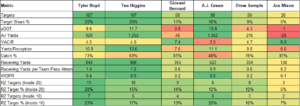
If you needed an example of why targets and target share don’t tell the full picture, let the Bengals be your lesson. Boyd, Higgins and Green had target volume within spitting distance of each other, yet you were a lot happier with Higgins or Boyd on your team than AJ Green. Look at Green’s YAC/R (Yards after catch per reception) and catch percentage, despite similar aDOT (average depth of target) and air yards to Higgins.
Don’t forget to scratch the surface. When Mixon was on the field he had over 70-percent of rush attempts and in the first five games of the season he had two games over 80-percent. With Mixon out, it was much more of a committee. Putting it another way, Mixon had 30-percent of total rush attempts despite only playing six games.


