Return to Draft Kit
2022 Yards PER Score
An RB1, RB2, WR1, WR2 don’t actually mean anything. Is there a bigger difference between RB12 and RB13 than there is between RB4 and RB7? It doesn’t make sense to use these arbitrary cut-offs when the player values don’t follow the same pattern, there’s a better way…
Introducing the Yards PER Score (Points above Expected Round value).
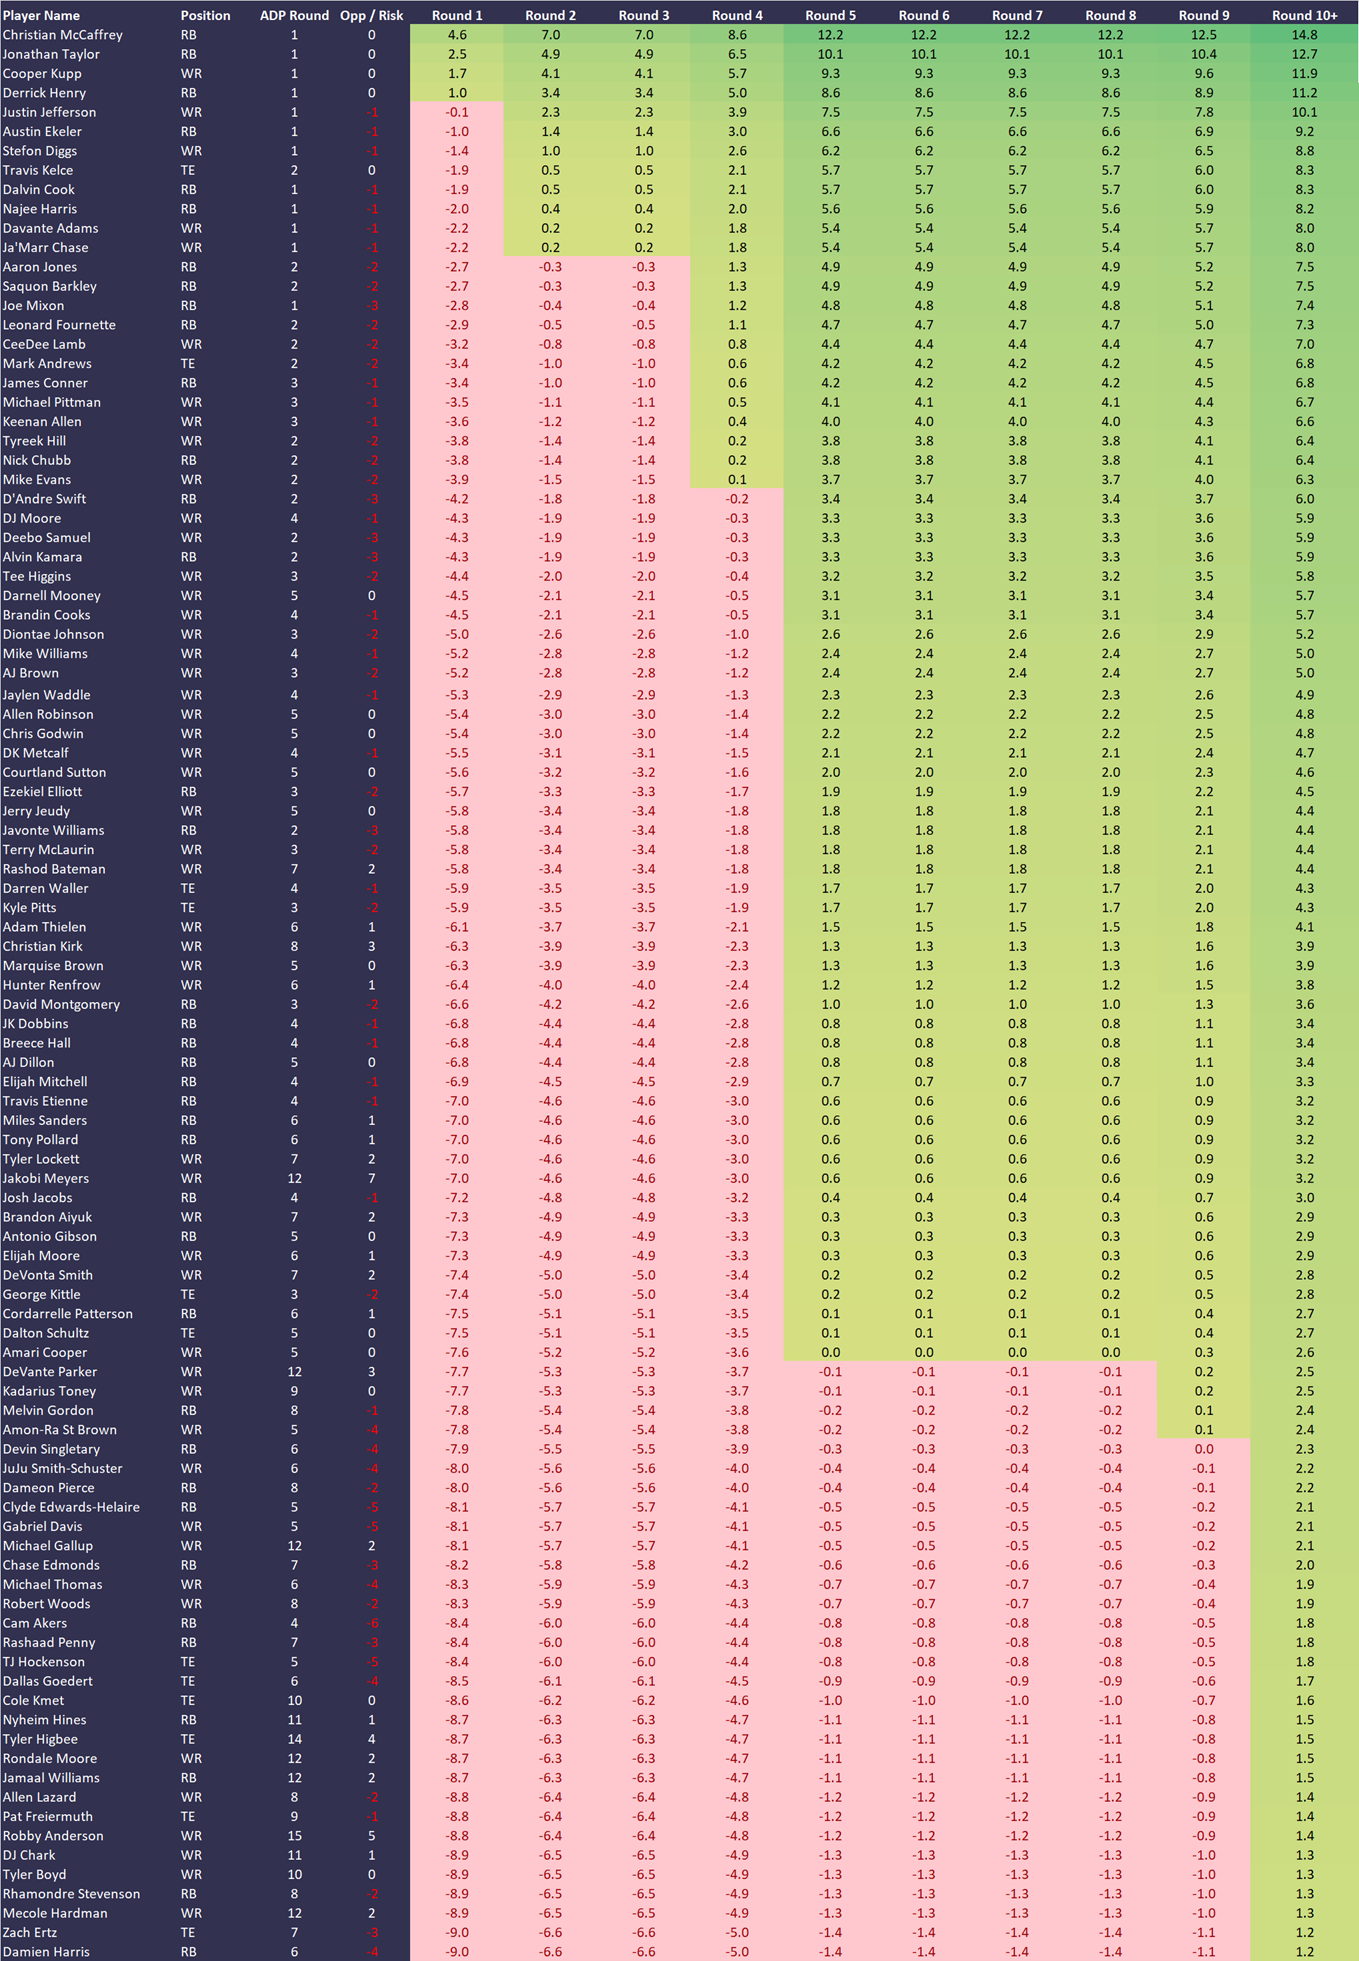
These tables compare projected points per game to the value that you should expect to get from a player drafted in any given round. For example, if round 6 has an expected round value of 10 then you should be expecting 10 points per game from a player you draft in that round. If they are projected to score 12 points per game, then you have a +2 for that player in round 6.
Each player is shown for each round so you can see the ‘break-even’ point where a player’s projection moves from a negative (less than the expected round value) to a positive (more than the expected round value). This is the point where that player becomes a value and no-longer a ‘reach’.
On the left hand side of the tables is the current ADP (average draft position) of that player and an ‘Opp/Risk’ number which tells you the Opportunity or Risk level of drafting that player at that ADP. For example a +1 means that player is being drafted 1 round later than he should be so has a 1 round opportunity value. A -2 means that player is being drafted 2 rounds earlier than he should be so has a 2 round risk value. Be willing to get your guys and ‘reach’ if you have to but don’t overdo it!
Note: These tables show the top 100 non-QB players only. If a player is not on this list, it means they’re outside the projected top 100 players and wherever you draft them would be based on the hope that they outperform their ‘likely’ outcome
Updated: 1 September 2022
10 Team Half-PPR
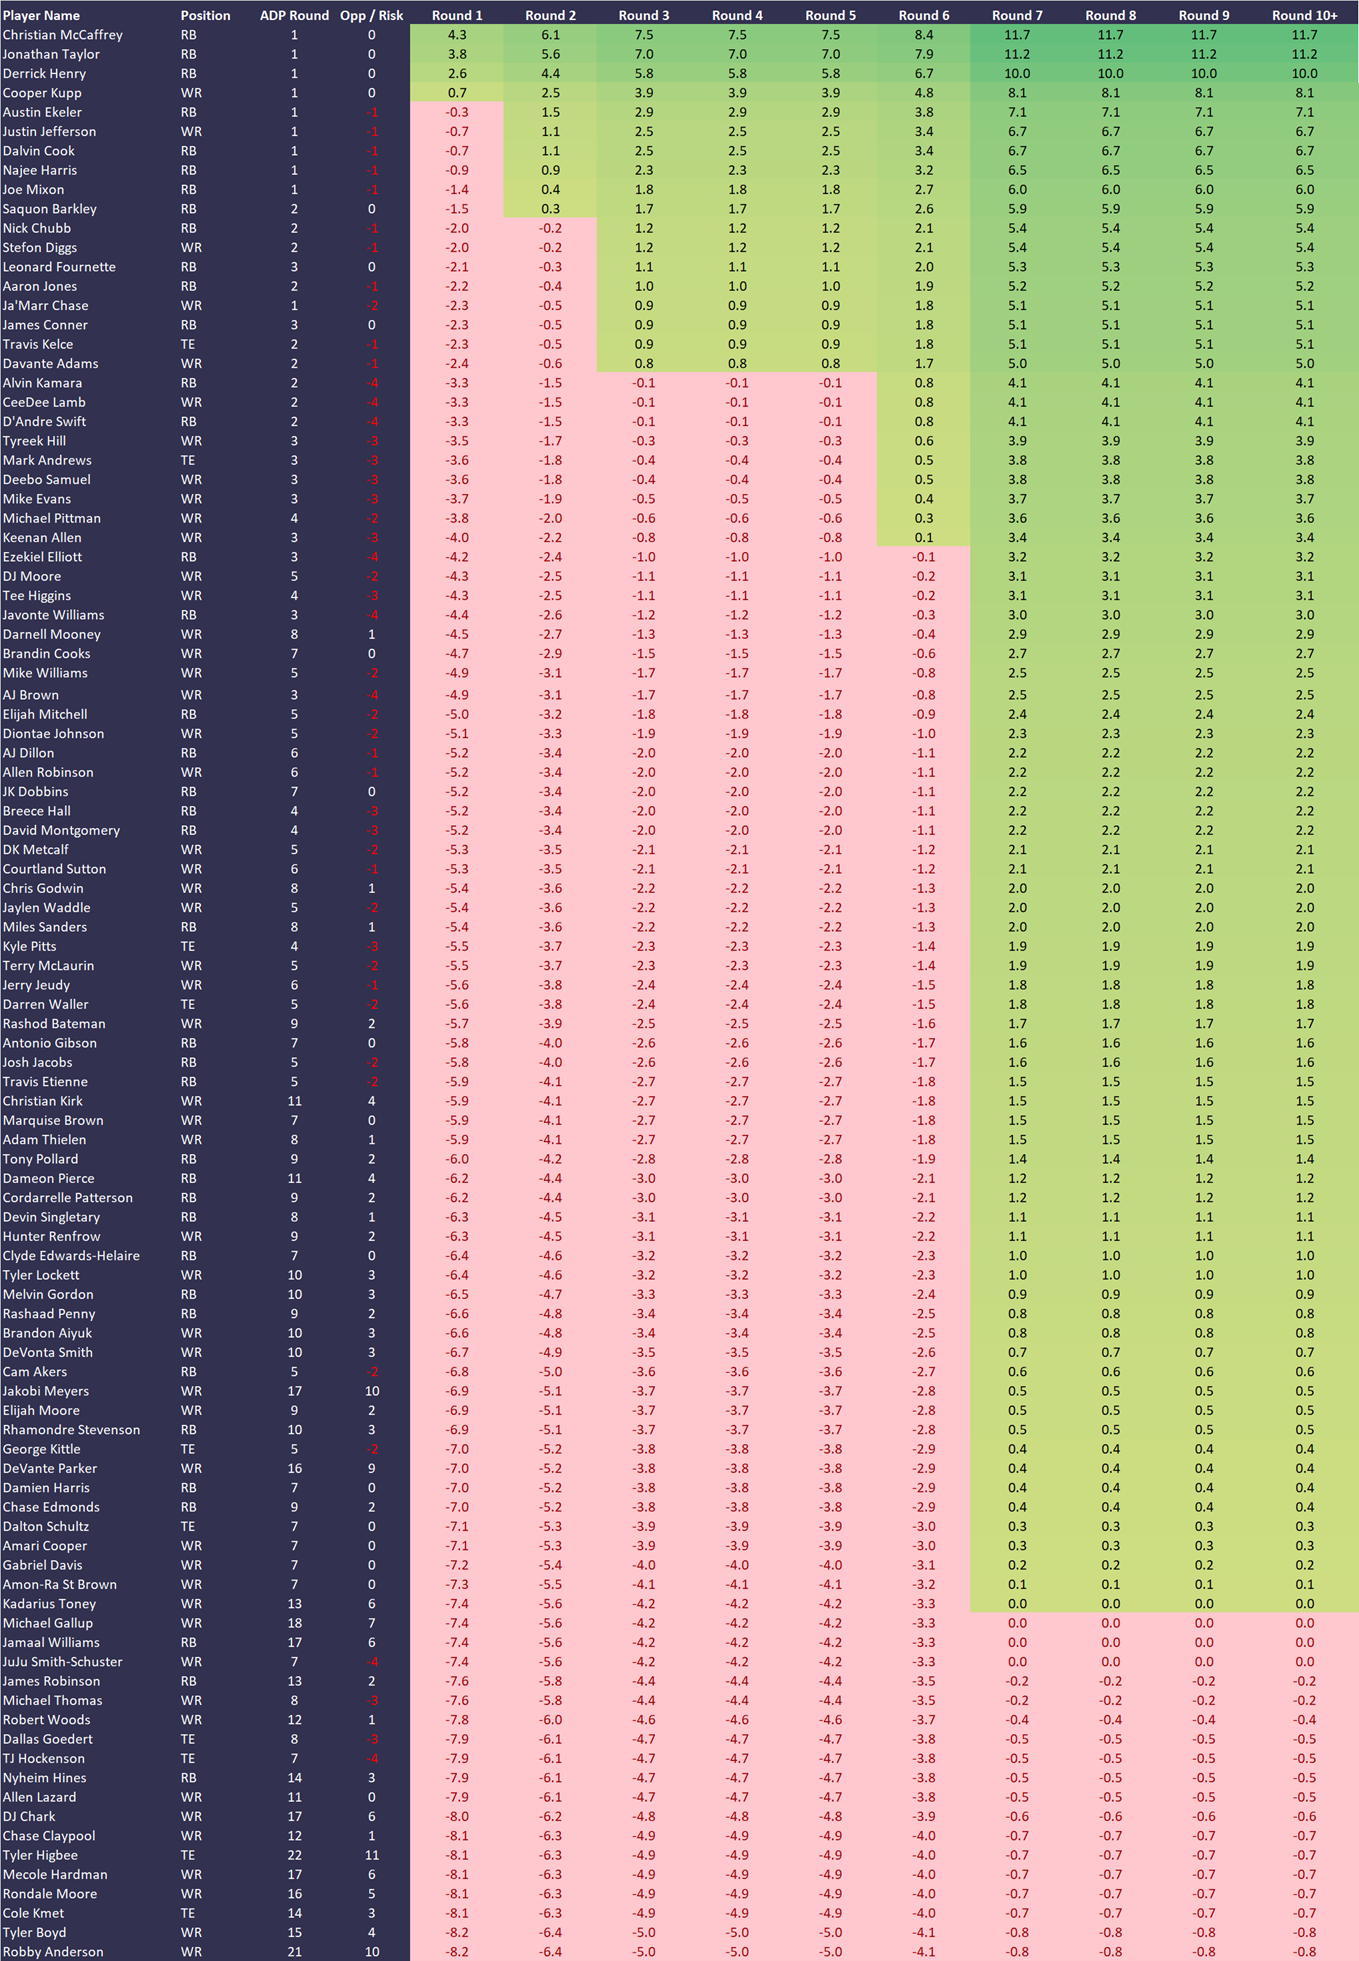
12 Team Half-PPR
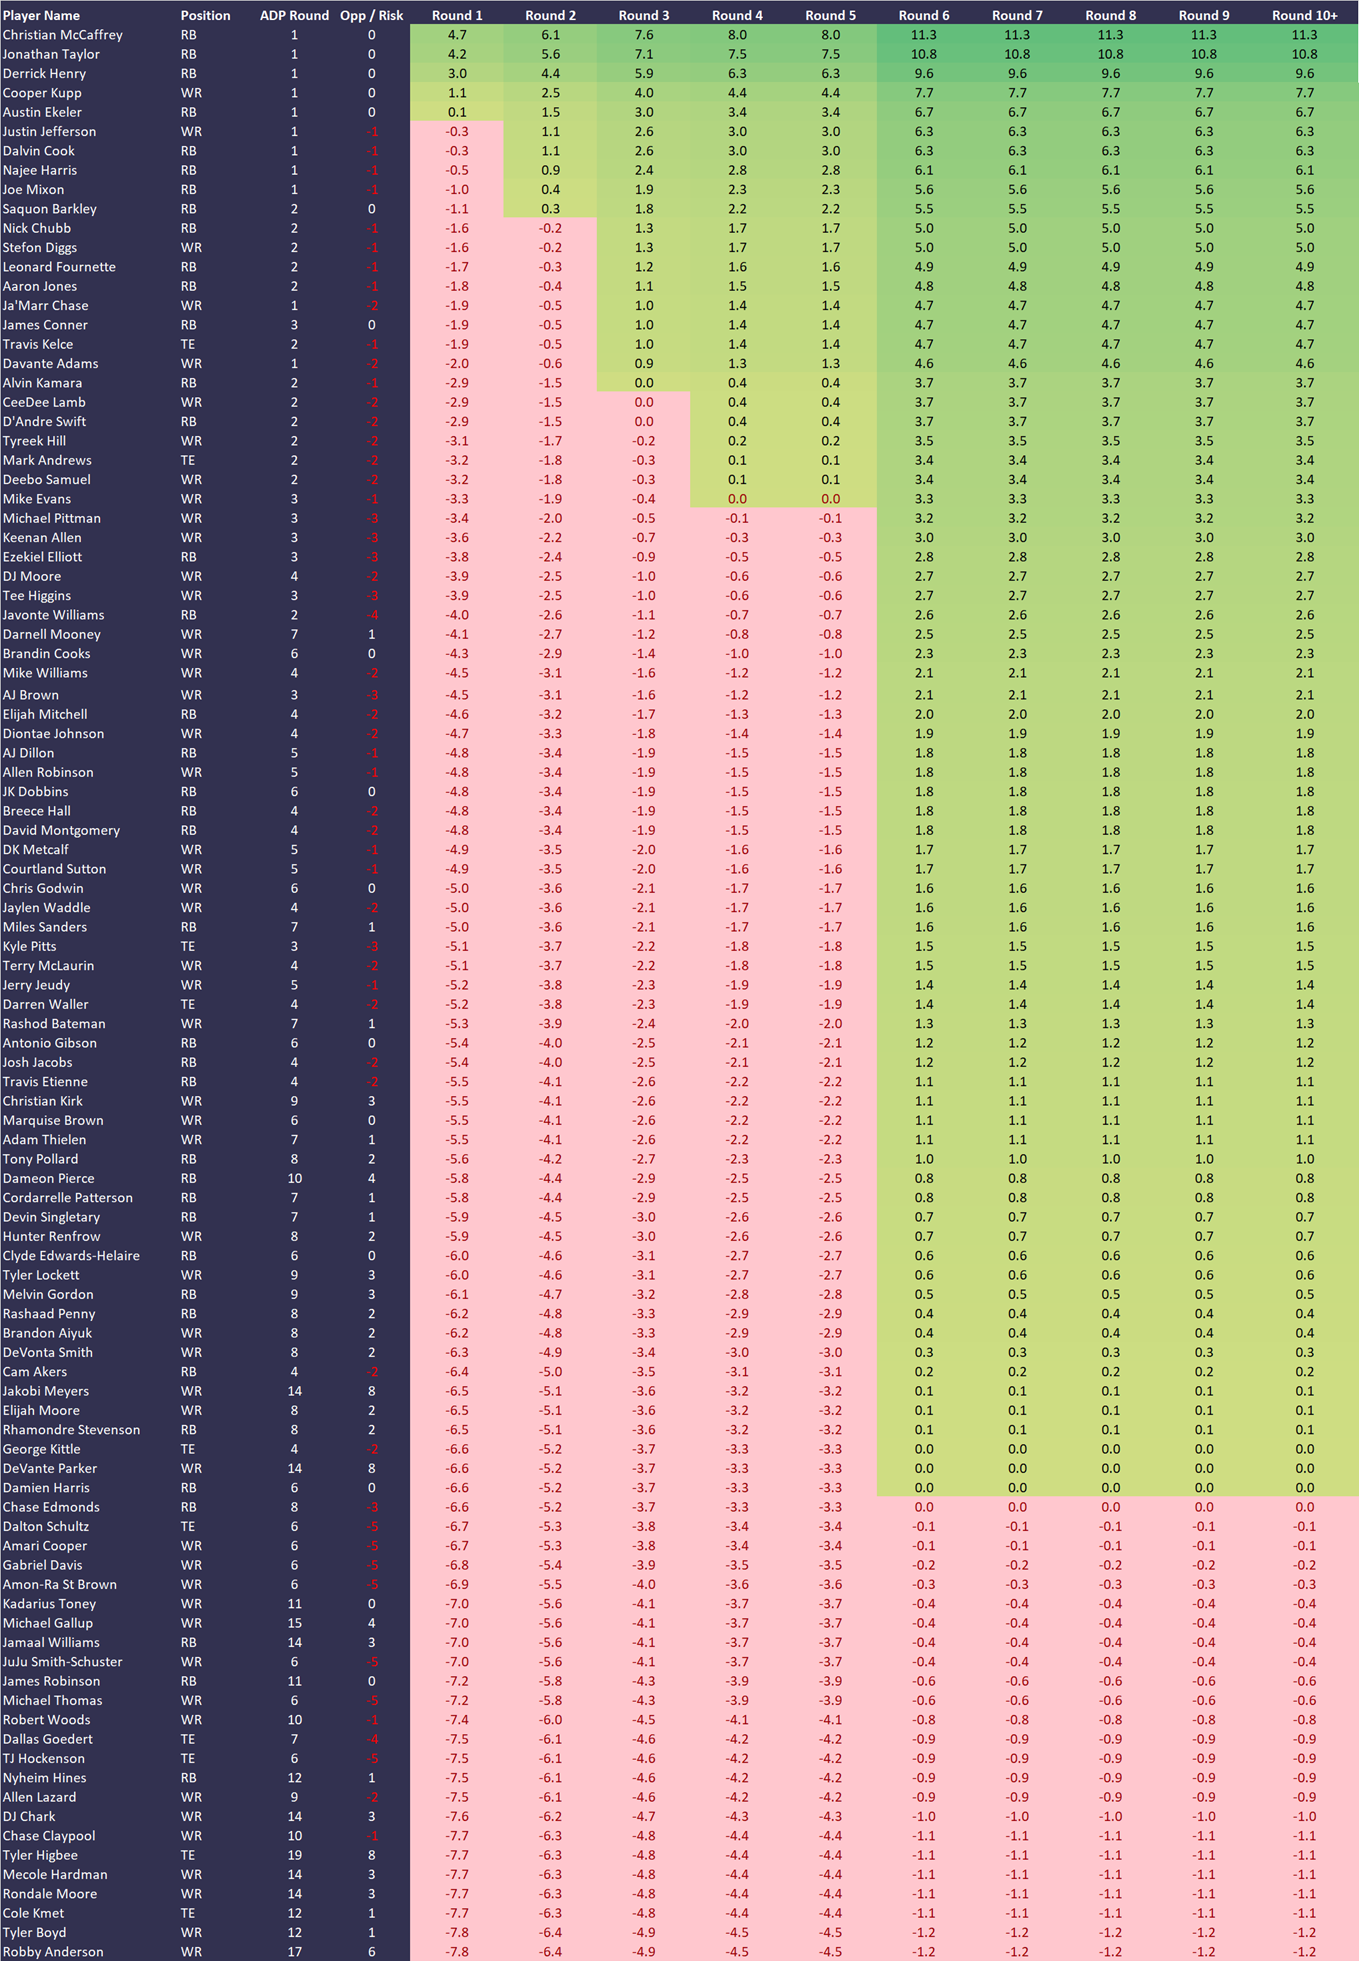
14 Team Half-PPR
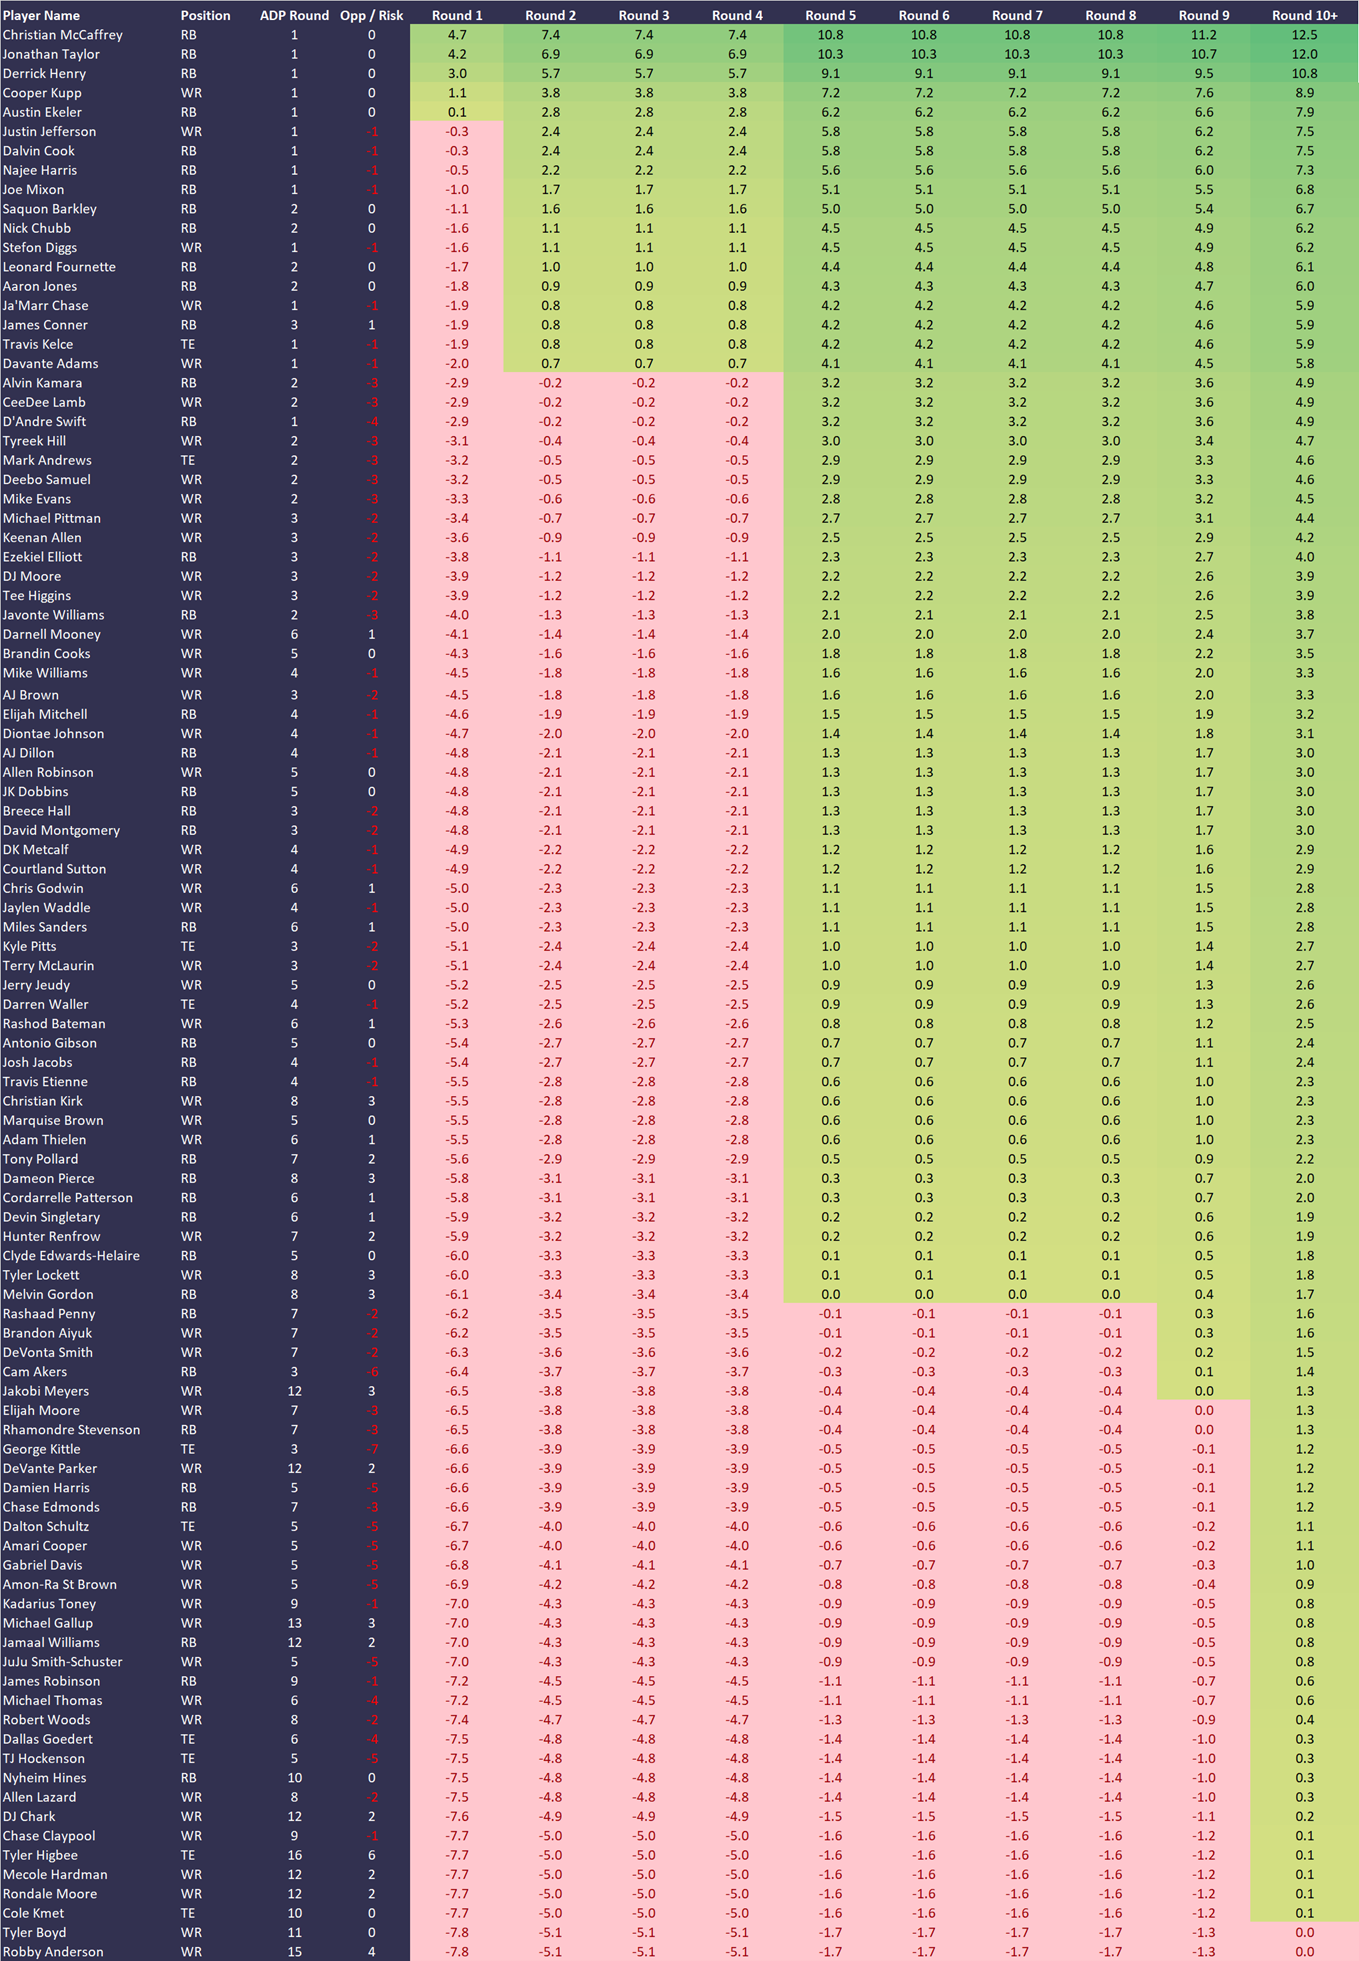
10 Team PPR
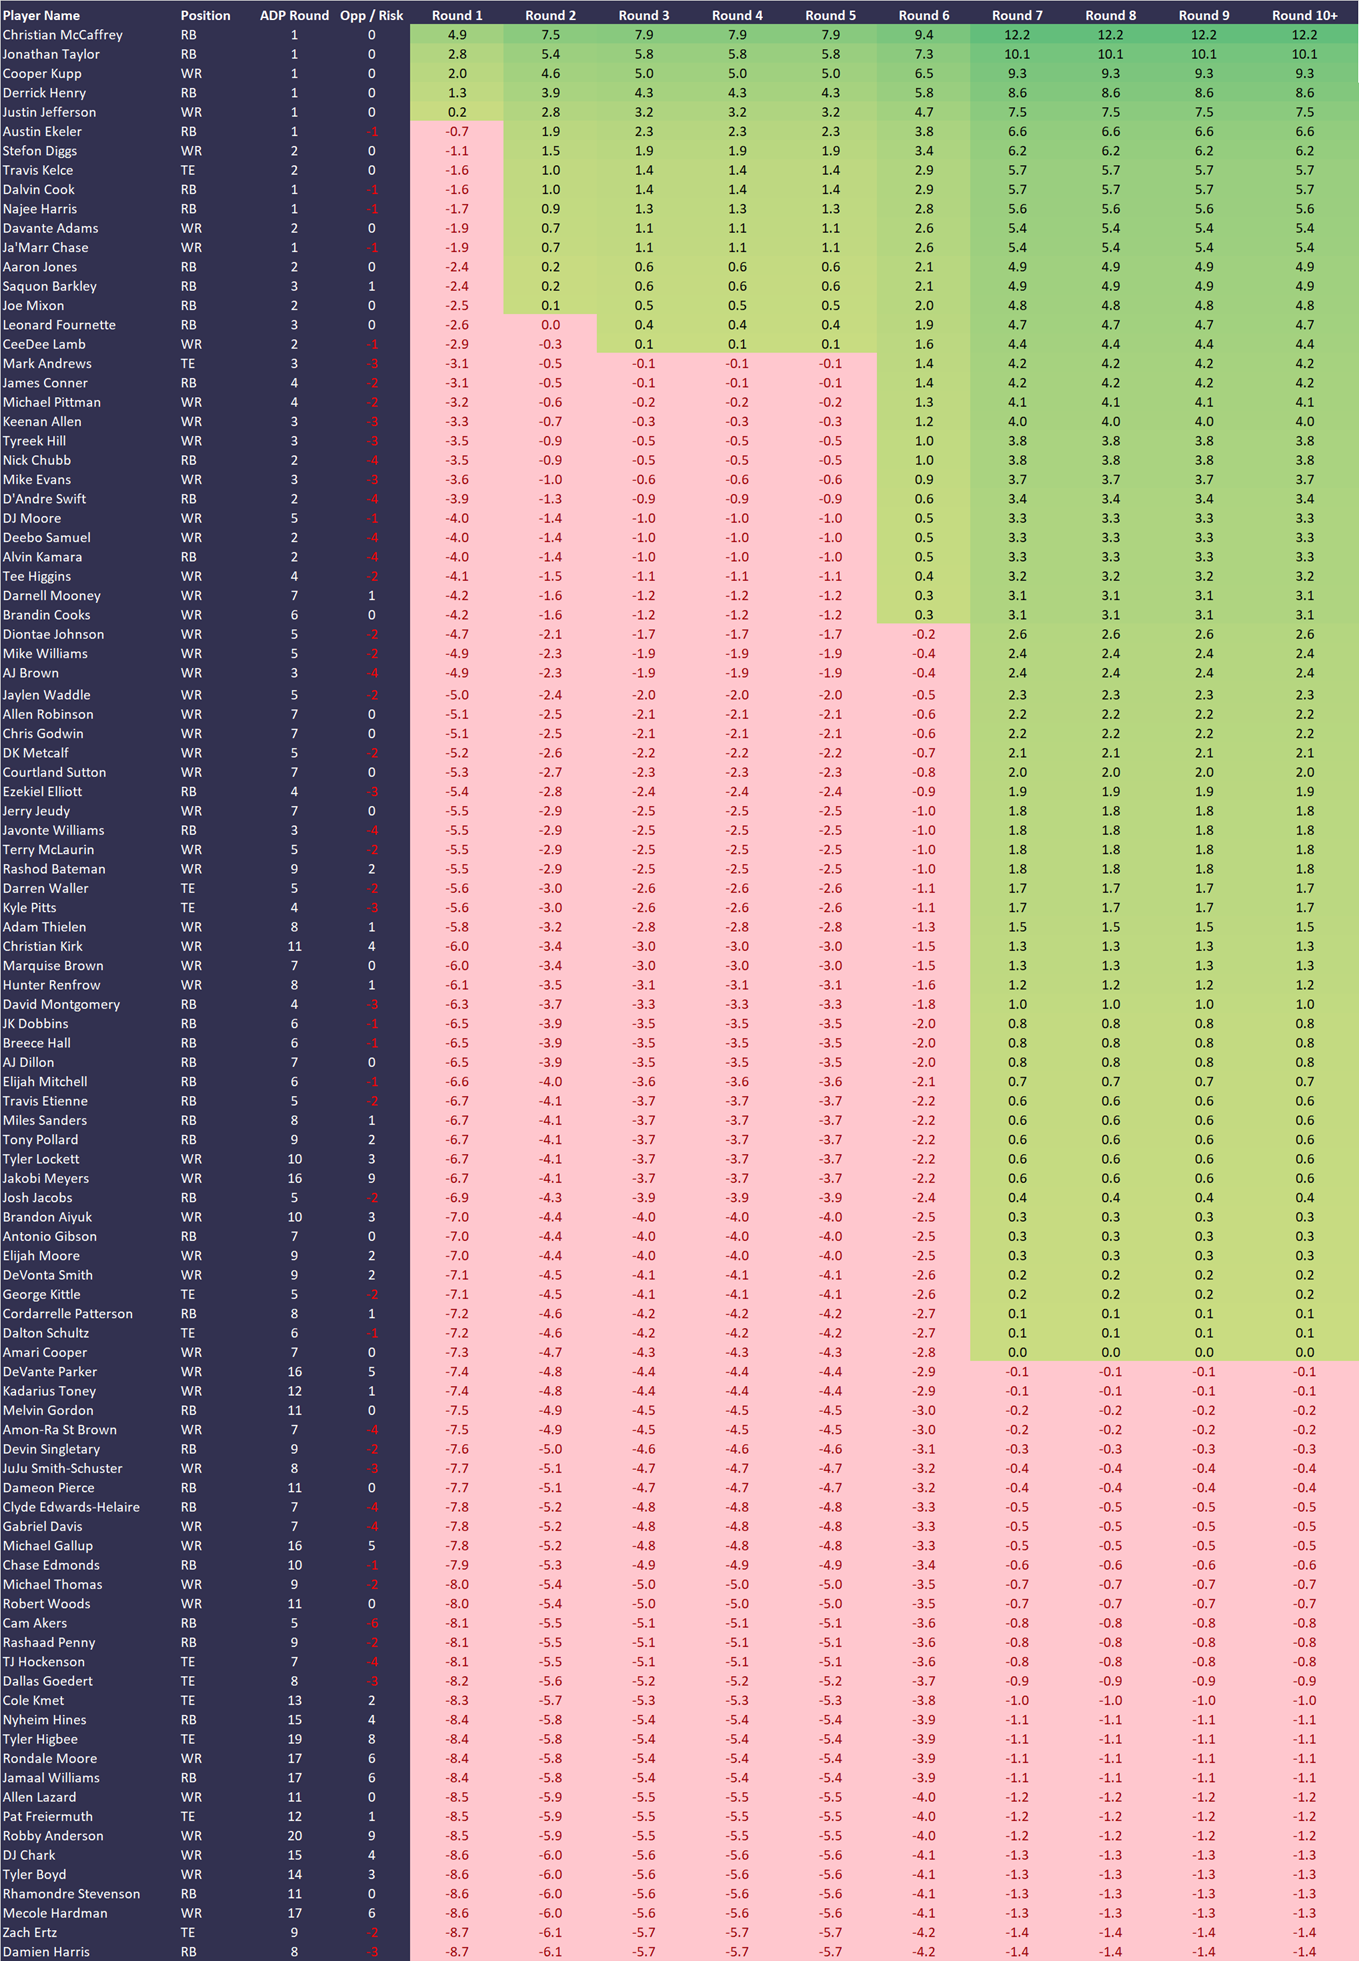
12 Team PPR
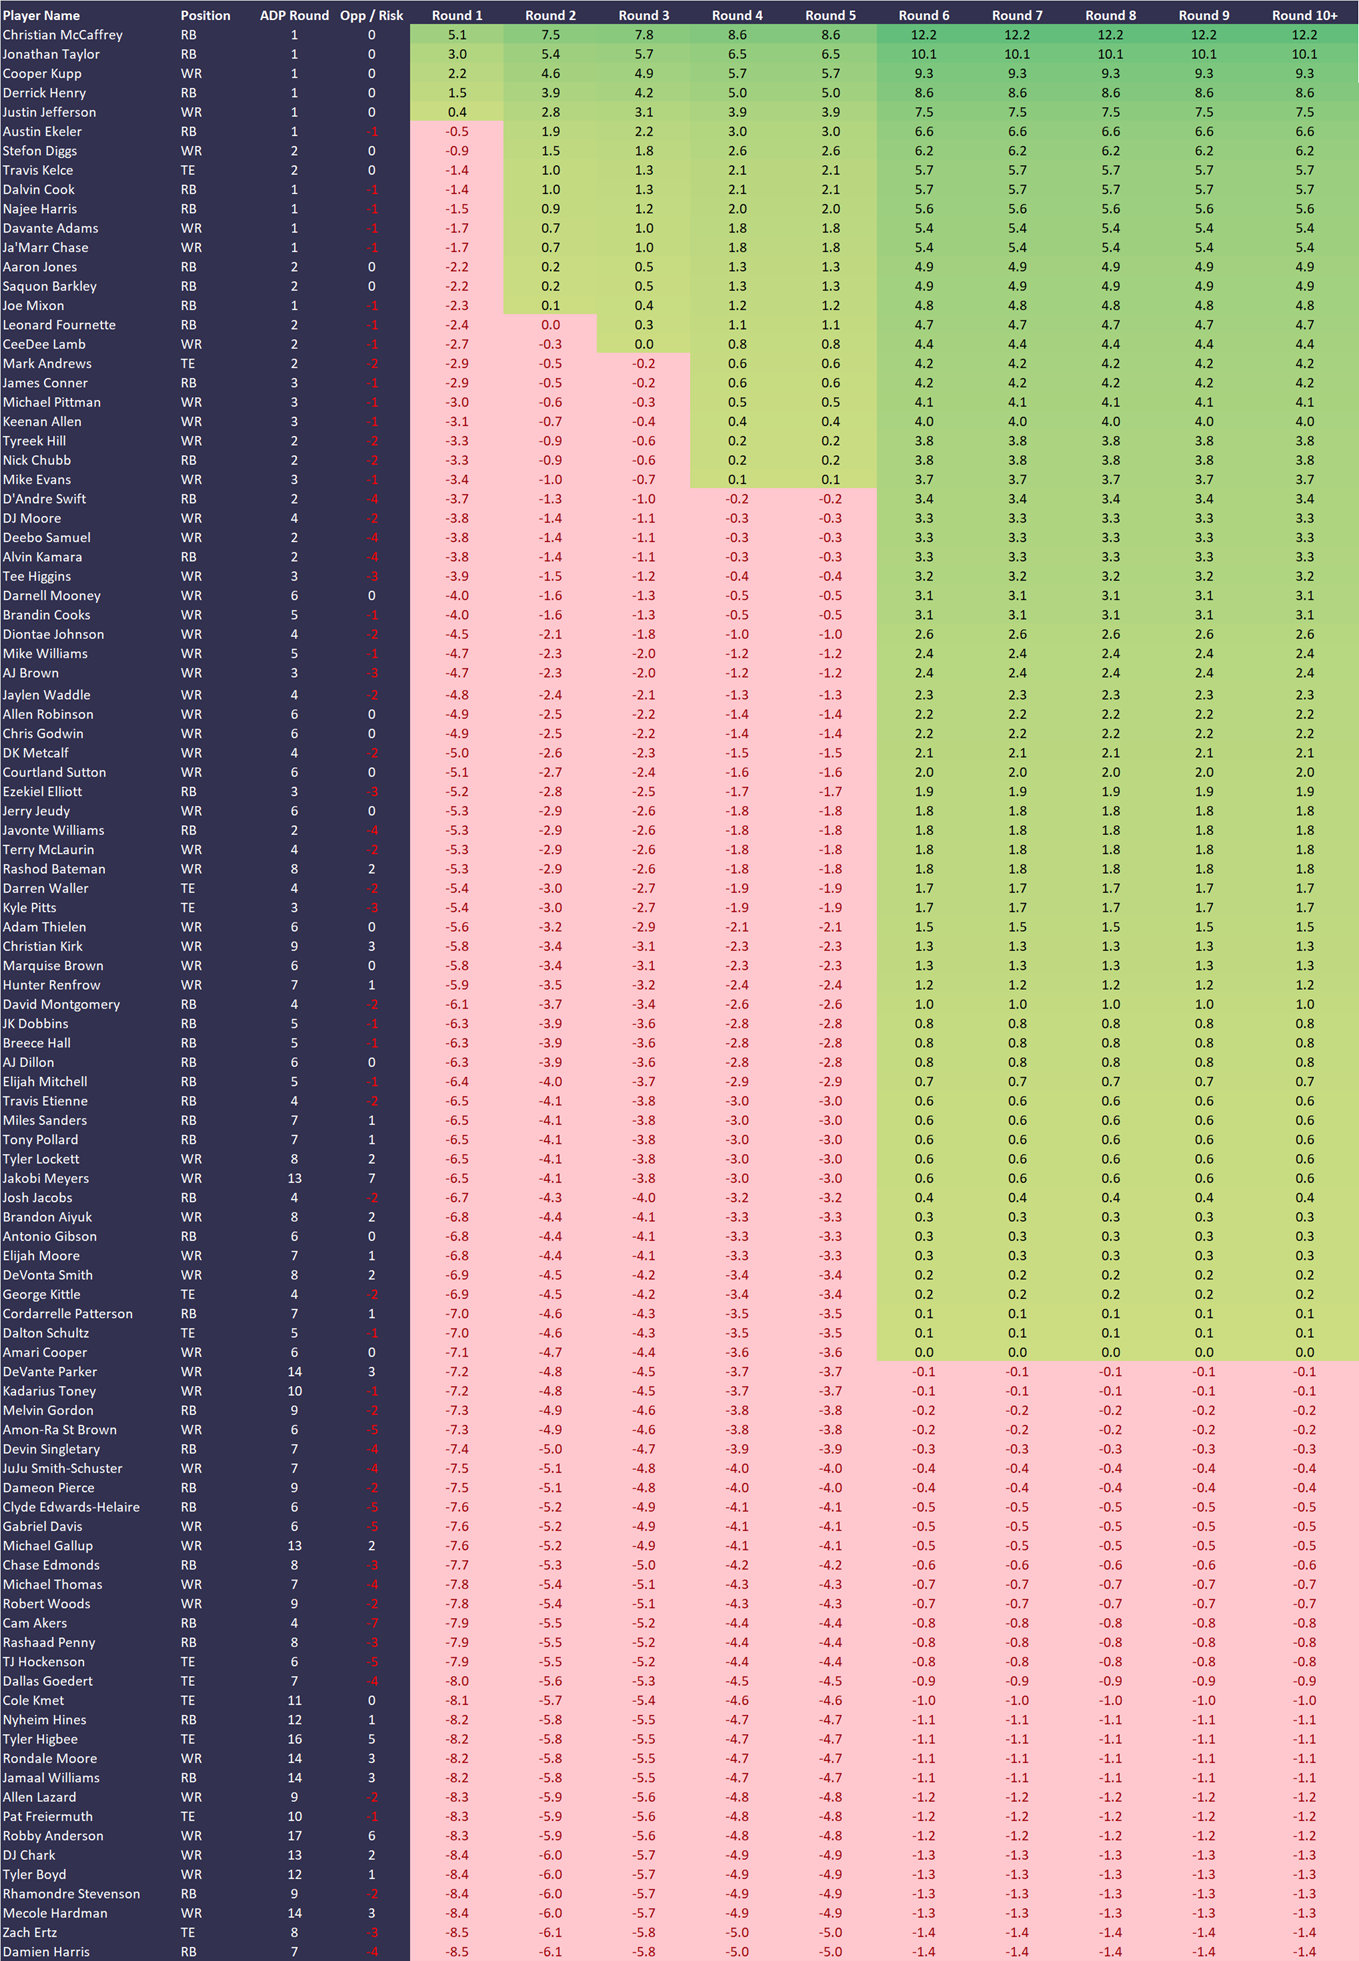
14 Team PPR
