Week 9 Review: Looking Back At Projections
This week’s top random performers were:
- Drew Lock QB4 (although he was QB7 last week so not sure how much longer he can be ‘random’)
- Kalen Ballage RB4
- Devontae Booker RB6
- Richie James WR1
- Irv Smith TE2
Predicting these players can be a fools-errand most of the time but what we can do is understand the ‘why’ of what happened so that we have a better chance of predicting the ‘what’ next time around.
As always, I’m not going to spend time working through waiver wire adds, or buy low/sell high candidates, but instead I’m going to take a retrospective look at the assumptions I used for my weekly projections. I’ll pick out where I was significantly different, where I was close, and some of the players that sit at either end of some key stats on the week.
Let’s get into the Week 9 review.
Week 9 Review: Team play counts
Key Stats
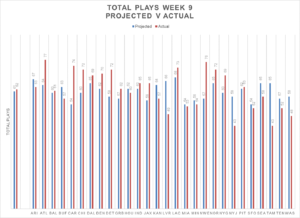
- Highest: New England Patriots (76 plays)
- Lowest: New York Jets (44 plays)
- Average: 63 plays
The Facts
- The Patriots’ 76 plays is their highest of the season, contrasted with the Jets’ 44 plays being their lowest. Yet that dominance didn’t reflect on the scoreboard until the last play of the game
- Carolina and Detroit had their most plays of the season with 74 and 72 respectively
- 58-percent of teams are running more than 60 plays (that number has been stable for four weeks in a row now) and the average number of plays has been 62 or 63 every week since week 2 (2019 average was 61)
- 17 teams hit the over on their Vegas implied totals in week 9 and 75-percent (21 of 28) were within one score (up from 68-percent in week 8). 15 teams were within 5 points, 9 teams were within a field goal and Baltimore was perfect
- The Chargers and the Cowboys are still duking it out for the highest average plays per game with 70.4 and 70.7 respectively
- Minnesota are holding off Houston to retain the crown as the team with the lowest average play volume
- The Giants’ 69 plays is their highest since 2017 while the Raiders’ 49 plays was their lowest since week 9 of 2018
The Results
- The average number of plays across the league was out by only 1 and 20 of 28 teams (71-percent) were within 10 plays (up by three from last week)
- 12 were within 5 plays (up by two), I was 1 out on 3 teams but no perfect hits this week
Week 9 Review: Pass Attempts
Key Stats
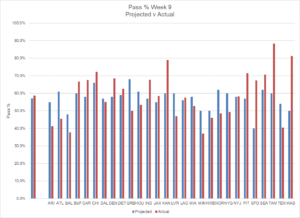
- Highest: Chicago Bears (52 attempts – 72-percent passing)
- Lowest: Minnesota Vikings (20 attempts – 37-percent passing)
- Average: 36 pass attempts
The Facts
- Chicago have now ticked up to 65-percent as the highest average pass rate in the league this season. Without the games Trubisky started, it’s at 69-percent
- Minnesota’s 20 pass attempts continues to be the lowest mark in the league. That’s now 6 of 8 games with less than 30 pass attempts for the Vikings
- Seattle’s 71-percent pass rate was their highest of the season to date while Pittsburgh also had a season high 71-percent against those pesky competitive Cowboys
- Atlanta are supposed to be a pass-heavy team aren’t they? Well it’s now two weeks in a row with a 45-percent pass rate
- Detroit have averaged 67-percent in their last three games, which would top Chicago’s average over a full season
- The lowest average pass rate still belongs to Baltimore with 45-percent, with New England and Minnesota the only other teams below 50-percent
I’m going to keep this note here every week – this metric will always be gamescript driven so the trick is going to be getting that right. The reliance is still on the Vegas over/under and implied team totals to drive my projection totals so getting that right is going to help to get closer.
The Results
- 12 of 28 teams had a pass-ratio within 10-percent of projection (down from 14 last week)
- 6 were less than 5-percent off (down from 9); and 1 within 1-percent
- Closest hit was the Jets with only a 0.1-percent difference
- Biggest misses for the week were Washington and Tampa Bay but more on them in a minute…
Rush Attempts
Key Stats
- Highest: New England (41 attempts)
- Lowest: Tampa Bay (5 attempts)
- Average: 25 rush attempts
The Facts
- A significant eight teams had less than 20 rush attempts in week 9 (5 in weeks 5 and 6, 2 in week 7 and 3 in week 8)
- Washington’s 9 rush attempts was monumentally low. I looked back to 1946 to find a game where they had less and didn’t find any
- Not to be out-done, Tampa Bay had 5 rush attempts. 5! And one of them was a kneel-down. Now that, my friends, is an NFL record
- Kansas City have decided to stop running the ball. Let Patrick Mahomes do what he does and win games, it works
Intended Air Yards per Attempt (IAY/A)
Key Stats
- Highest: Joe Flacco (12.6 yards per attempt)
- Lowest: Alex Smith (3.3 yards per attempt)
- Average: 7.8 Intended Air Yards per Attempt
The Facts
- This week’s non-QB taking the top of the charts was Joseph Charlton (Carolina punter)
- 12.2 yards is a high for Derek Carr over the last three years by a long stretch
- Meanwhile, Lamar Jackson went through the floor with a career low 3.7 yards
- And with Washington always wanting to be bottom of the pile in most categories, Alex Smith takes the title of dump off king with his 3.3 yards in week 9
The Results
- 75-percent of QBs were within 2 yards of projection (up from 71-percent last week)
- 32-percent were within a yard (down from 46-percent)
- 5 QBs within 0.5 yards, only 0.1 yards off on Lock and Gilbert, and a perfect hit on Mullens
Targets
Top Targets
| 1 | Tyreek Hill | 18 |
| = 2 | JD McKissic | 14 |
| = 2 | Jerry Jeudy | 14 |
| = 2 | Jakobi Meyers | 14 |
| = 5 | Robby Anderson | 13 |
| = 5 | Chase Claypool | 13 |
Target Market Share (Percentage of Team’s Target Share)
| = 1 | Darren Waller | 43 |
| = 1 | AJ Brown | 43 |
| 3 | Tyreek Hill | 42 |
| 4 | Jakobi Meyers | 41 |
| = 5 | Richie James | 38 |
| = 5 | Davante Adams | 38 |
A few other notable receivers who saw double digit targets and around 30-percent market share:
- Stefon Diggs – 12 targets, 32-percent market share
- Keenan Allen – 12 targets, 29-percent market share
- DJ Chark – 12 targets, 32-percent market share
- Travis Kelce – 12 targets, 28-percent market share
- John Brown – 11 targets, 29-percent market share
- Evan Engram – 10 targets, 30-percent market share
Carries
Top Carries
| = 1 | James Robinson | 25 |
| = 1 | Chase Edmonds | 25 |
| 3 | Dalvin Cook | 22 |
| 4 | Derrick Henry | 21 |
| 5 | Todd Gurley | 19 |
Carry Market Share (Percentage of Team’s Carry Share)
| 1 | James Robinson | 93 |
| 2 | Christian McCaffrey | 78 |
| 3 | Jerick McKinnon | 71 |
| 4 | David Montgomery | 70 |
| = 5 | Derrick Henry / Chase Edmonds | 68 |
Notable additions:
- Clyde Edwards-Helaire – 63-percent market share but only 5 carries
- Ronald Jones – 60-percent market share but only 3 carries
- Antonio Gibson – 67-percent market share but only 6 carries
- Duke Johnson – 16 carries and 57-percent market share with David Johnson missing time
Week 9 Review: Summary
- When Vegas get close with their implied team totals, we can get much closer with the volume projections
- The biggest misses this week were teams that just did not run the ball, and there were more of them than most weeks
- We’re starting to get an idea of the main targets that the backup QBs are locking on to (McKissic for Alex Smith, Chark for Jake Luton, etc)
- Refinements to the process are key but the principles remain the same, projecting the team volume is essential to the success of individual player projections
Be ready to adapt, be ready to learn from ‘why’ things happened, and be ready to adjust the ‘what’ for the next round of projections.
A quick look ahead to Week 10’s process looks like we’re going to have some backup RBs with another shot at success (Edmonds, Davis, Duke Johnson, Gio Bernard perhaps) and there’s a couple of vegas implied totals that look ripe for the picking (Bills/Cardinals & Seahawks/Rams).
Now, Alex Smith, may I introduce you to Mr Gibson…


