Week 15 Review: Looking Back At Projections
This week’s top random performers were:
- Marcus Mariota QB8
- Tony Pollard RB1
- Zach Pascal WR5
- Logan Thomas TE2
Predicting these players can be a fools-errand most of the time but what we can do is understand the ‘why’ of what happened so that we have a better chance of predicting the ‘what’ next time around.
As always, I’m not going to spend time working through waiver wire adds, or buy low/sell high candidates, but instead I’m going to take a retrospective look at the assumptions I used for my weekly projections. I’ll pick out where I was significantly different, where I was close, and some of the players that sit at either end of some key stats on the week.
Let’s get into the Week 15 review.
Week 15 Review: Team play counts
Key Stats
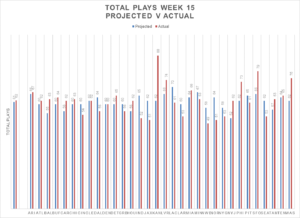
- Highest: Kansas City Chiefs (88 plays)
- Lowest: New England Patriots / New Orleans Saints (52 plays)
- Average: 64 plays
The Facts
- Green Bay‘s 56 plays was their joint lowest of the season while San Francisco‘s 79 plays was their highest
- Jacksonville had their lowest play total since week 1 with 51 plays and Indianapolis had their 2nd lowest of the season with 52 plays
- Houston and New York Jets both had their highest since week 6 with 62 plays each, while Los Angeles Rams hit their season low of 53 plays
- Philadelphia‘s 73 plays was their 2nd highest of the season and Kansas City had their highest mark since week 3 of 2012 (also against New Orleans)
- 58-percent of teams are still running more than 60 plays (that’s now 10 weeks in a row of 57 or 58 percent)
- 17 teams hit the over on their Vegas implied totals in week 15 with 66-percent (21 of 32) within one score (up from 53-percent in week 14). 18 teams were within 5 points, 8 teams were within a field goal, 1 team was 1 out and the Dolphins hit bang on
- The Chargers are still top of the tree with the highest average play volume but have now ticked under 70
- New York Jets are still the team with the lowest average play volume but it’s pretty close with Houston
The Results
- The average number of plays across the league was out by 1 and 25 of 32 teams (78-percent) were within 10 plays (up by three from last week)
- 13 were within 5 plays (up by 1), I was 1 out on 2 teams and got a perfect landing on both Cleveland and Denver
Week 15 Review: Pass Attempts
Key Stats
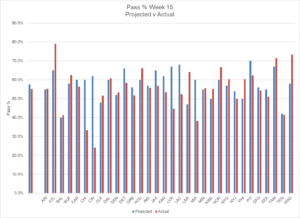
- Highest: Washington Football Team (55 attempts – 73-percent)
- Lowest: Cincinnati Bengals (13 attempts – 24-percent passing)
- Average: 34 pass attempts
The Facts
- Cincinnati‘s 24-percent pass rate is the lowest of any team this season, outside of the Kendall Hinton game, and their 13 pass attempts was their lowest since 2008
- Buffalo have hit 40+ pass attempts for three weeks in a row while Seattle hit their lowest of the season with 27
- After having the highest average pass rate in the league for most of the season, Chicago had their lowest of the season with 33-percent
- Miami‘s 38-percent pass rate was their lowest since week 3 and Atlanta hit their highest of the season with 79-percent
- Detroit had been over 60-percent for 8 straight weeks before dipping to 58-percent in week 15
- Houston‘s 41 pass attempts was their highest since week 6 with New Orleans hitting their joint highest rate of the season with 67-percent
- The lowest average pass rate is still held solely by Baltimore with 44-percent, while Cleveland (48-percent), New England (46-percent) and Tennessee (49-percent) are the only other teams below 50-percent
I’m going to keep this note here every week – this metric will always be gamescript driven so the trick is going to be getting that right. The reliance is still on the Vegas over/under and implied team totals to drive my projection totals so getting that right is going to help to get closer.
The Results
- 23 of 32 teams had a pass-ratio within 10-percent of projection (down from 24 last week)
- 16 were less than 5-percent off (up from 10 the last few weeks); and 4 within 1-percent
- Closest hit was the Cardinals with a 0.2-percent difference
- Biggest miss for the week was Cincinnati, I don’t think anyone saw them being in a position to be able to pass as little as they did
Rush Attempts
Key Stats
- Highest: Miami / Chicago (42 attempts)
- Lowest: Atlanta (13 attempts)
- Average: 28 rush attempts
The Facts
- Four teams had less than 20 rush attempts in week 15 while 6 teams ran more than 50-percent of the time
- New England‘s 22 rush attempts was their joint lowest of the season, as was Los Angeles Rams‘ 19 attempts
- Atlanta‘s 13 rush attempts was their lowest since week 10 2016
Intended Air Yards per Attempt (IAY/A)
Key Stats
- Highest: Ryan Finley (13.8 yards per attempt)
- Lowest: Aaron Rodgers (3.5 yards per attempt)
- Average: 7.9 Intended Air Yards per Attempt
The Facts
- Andy Lee, Tyler Huntley and Jacoby Brissett all had higher IAY/A than Finley but on 1, 4 and 1 pass attempts
- Justin Herbert’s 11.2 yards was the second highest of his career and marks the first time above 7.5 since week 7
- At the other end of the scale, Aaron Rodgers 3.5 yards was his lowest of at least the last three seasons by some way. His previous lowest in that time was 6.1
- It’s a similar story for Drew Lock and his 3.8 yards being the lowest of his career to date, as was the 3.8 yards for Tua
The Results
- 50-percent of QBs were within 2 yards of projection (up from 47-percent)
- 22-percent were within a yard (down from 28-percent)
- 4 QBs within 0.5 yards, 1 was 0.1 yards off and Deshaun Watson was spot on
Targets
Top Targets
| 1 | Logan Thomas | 15 |
| 2 | Calvin Ridley | 14 |
| = 3 | Stefon Diggs | 13 |
| = 3 | Diontae Johnson | 13 |
| = 3 | Brandon Aiyuk | 13 |
Target Market Share (Percentage of Team’s Target Share)
| 1 | Tee Higgins | 46 |
| 2 | Jakobi Meyers | 42 |
| 3 | Darren Waller | 40 |
| 4 | Davante Adams | 38 |
| 5 | Justin Jefferson | 37 |
A few other notable receivers who saw double digit targets and around 30-percent market share:
- Noah Fant – 11 Targets, 34-percent market share
- Marvin Jones – 12 targets. 32-percent market share
- DeAndre Hopkins – 11 targets, 30-percent market share
- David Johnson – 11 targets, 28-percent market share
- Travis Kelce – 12 targets, 27-percent market share
Carries
Top Carries
| 1 | David Montgomery | 32 |
| 2 | Josh Jacobs | 26 |
| 3 | Giovani Bernard | 25 |
| = 4 | Derrick Henry | 24 |
| = 4 | Dalvin Cook | 24 |
Carry Market Share (Percentage of Team’s Carry Share)
| 1 | Dalvin Cook | 86 |
| 2 | Cam Akers | 79 |
| = 3 | Benny Snell Jr | 78 |
| = 3 | Leonard Fournette | 78 |
| 5 | David Montgomery | 76 |
Notable additions:
- Browns: Nick Chubb – 50-percent market share; Kareem Hunt – 23-percent market share
- Falcons: Ito Smith – 46-percent market share; Brian Hill – 38-percent market share
- Packers: Aaron Jones – 74-percent market share; Jamaal Williams – 4-percent market share
- Lions: D’Andre Swift – 56-percent market share; Adrian Peterson – 22-percent market share
- Football Team: JD McKissic – 65-percent market share; Peyton Barber – 20-percent market share
- Ravens: JK Dobbins – 38-percent market share; Gus Edwards – 24-percent market share
- Miles Sanders – 59-percent market share
- Jonathan Taylor – 70-percent market share
- Mobile Quarterbacks: Cam Newton (41-percent), Jalen Hurts (38-percent), Deshaun Watson (29-percent), Kyler Murray (27-percent), Lamar Jackson (27-percent), Russell Wilson (23-percent), Marcus Mariota (22-percent)
Week 15 Review: Summary
- When Vegas get close with their implied team totals, we can get much closer with the volume projections
- The pass-ratios need some work and, as always, correctly predicting the gamescript is the play
- Refinements to the process are key but the principles remain the same, projecting the team volume is essential to the success of individual player projections
Be ready to adapt, be ready to learn from ‘why’ things happened, and be ready to adjust the ‘what’ for the next round of projections.
A quick look ahead to Week 16’s process once again is a navigation of injuries and backup quarterbacks. Baltimore and Kansas City are the only double-digit favourites so it could be a much tighter group of projections to flush through.
That’s it for 2020 folks, thank you to all that have read and followed this series this season.
Good luck in your championship game and let us know how you go!


