Week 13 Review: Looking Back At Projections
This week’s top random performers were:
- Baker Mayfield QB3
- Ty Johnson RB7
- Corey Davis WR1
- Dan Arnold TE5
Predicting these players can be a fools-errand most of the time but what we can do is understand the ‘why’ of what happened so that we have a better chance of predicting the ‘what’ next time around.
As always, I’m not going to spend time working through waiver wire adds, or buy low/sell high candidates, but instead I’m going to take a retrospective look at the assumptions I used for my weekly projections. I’ll pick out where I was significantly different, where I was close, and some of the players that sit at either end of some key stats on the week.
Let’s get into the Week 13 review.
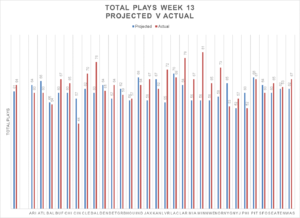
Week 13 Review: Team play counts
Key Stats
- Highest: Minnesota Vikings (85 plays)
- Lowest: Cincinnati Bengals (50 plays)
- Average: 66 plays
The Facts
- The 85 plays ran by Minnesota is their highest since week 13 of 2013
- Meanwhile, Cincinnati have had their lowest play totals over the last two weeks having only dipped below 60 once before Burrow got injured
- New Orleans hit their season high as Philadelphia hit their season low
- 58-percent of teams are still running more than 60 plays (that’s now 8 weeks in a row of 57 or 58 percent) and the average number of plays was at its highest point of the season, bouncing back from week 12’s season lowest mark
- 15 teams hit the over on their Vegas implied totals in week 13 with 73-percent (22 of 30) within one score (up from 69-percent in week 12). 14 teams were within 5 points, 9 teams were within a field goal and 2 teams were 1 out
- The Chargers remain alone at the top of the tree with the only highest average play volume above 70 plays
- Houston are still the team with the lowest average play volume but the New York Jets are giving them a run for their money
The Results
- The average number of plays across the league was out by 3 (higher than usual) and 21 of 30 teams (70-percent) were within 10 plays (down by two from last week)
- 15 were within 5 plays (down by two), I was 1 out on 4 teams and didn’t quite get any team spot on this week
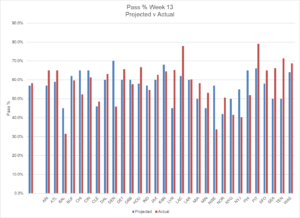
Week 13 Review: Pass Attempts
Key Stats
- Highest: Los Angeles Chargers / Pittsburgh Steelers (53 attempts – 78-percent and 79-percent passing respectively)
- Lowest: Baltimore Ravens (17 attempts – 31-percent passing)
- Average: 37 pass attempts
The Facts
- Las Vegas’ 47 pass attempts was their highest since week 4 of 2018 while Dallas’ 48 pass attempts was their highest since Dalton’s first game as starter
- Pittsburgh had their highest number of pass attempts (53) in two years as they equaled their season high 79-percent pass rate
- Chicago still have the highest average pass rate in the league this season, but that has dropped slightly to 65-percent as they put up their lowest rate (52-percent) since week 2. The Trubisky factor…
- Detroit continue to pass over 60-percent of the time. That’s seven weeks in a row having only achieved it once in their first five games
- New York Giants on the other hand hit their joint lowest pass rate of the season with only 42-percent
- The lowest average pass rate is held solely by Baltimore with 44-percent, while Cleveland (47-percent), and New England (46-percent) are the only other teams below 50-percent. Previous basement-dwellers Minnesota and Tennessee have hit 50-percent
I’m going to keep this note here every week – this metric will always be gamescript driven so the trick is going to be getting that right. The reliance is still on the Vegas over/under and implied team totals to drive my projection totals so getting that right is going to help to get closer.
The Results
- 19 of 30 teams had a pass-ratio within 10-percent of projection (up from 16 last week)
- 10 were less than 5-percent off (same as last week); and 1 within 1-percent
- Closest hit was the Rams with a 0.3-percent difference
- Biggest miss for the week was Denver who stayed way more competitive than I expected them to and were able to run more than 50-percent of the time as a result
Rush Attempts
Key Stats
- Highest: New England (43 attempts)
- Lowest: Pittsburgh (14 attempts)
- Average: 27 rush attempts
The Facts
- Five teams had less than 20 rush attempts in week 13 while 6 teams ran more than 50-percent of the time
- New York Jets 33 rush attempts is their highest since week 6 of 2018
- Denver have had exactly 33 rush attempts for three games in a row – it’s the magic number
Intended Air Yards per Attempt (IAY/A)
Key Stats
- Highest: Matthew Stafford (13.1 yards per attempt)
- Lowest: Jared Goff (3.6yards per attempt)
- Average: 8.2 Intended Air Yards per Attempt
The Facts
- Non-quarterbacks throwing the ball this week include Tyler Boyd and Jarvis Landry (I really wanted to add Carson Wentz name here too but I won’t do it I promise…)
- Stafford’s 13.1 yards was his highest in at least the last three seasons and only the second time this season over 10. A sign of things to come under a new regime?
- Jalen Hurts was also slinging it like Stafford with 13.1 IAY/A but on only 12 pass attempts
- Matt Ryan has been all over the map in the last couple of weeks with easily his lowest of the season last week (5.7 yards) followed this week with his highest in at least the last three seasons (11.6 yards)
- Jared Goff’s 3.6 yards was monumentally low and represents his lowest for at least the last three seasons, while Alex Smith continues his run of less than 6 yards with 5.8 IAY/A
- He only threw the ball 7 times but Ryan Finley’s 1.1 IAY/A doesn’t bode well for any of the Bengals pass catchers if he has any prolonged period under centre
The Results
- 60-percent of QBs were within 2 yards of projection (up from 56-percent)
- 30-percent were within a yard (down from 31-percent)
- 7 QBs within 0.5 yards and Cam Newton was 0.1 yards off
Targets
Top Targets
| 1 | Darren Waller | 17 |
| = 2 | DeAndre Hopkins | 13 |
| = 2 | Travis Kelce | 13 |
| = 4 | Davante Adams | 12 |
| = 4 | Diontae Johnson | 12 |
| = 4 | Justin Jefferson / Corey Davis / Marvin Jones | 12 |
Target Market Share (Percentage of Team’s Target Share)
| 1 | Marquise Brown | 50 |
| 2 | Jamison Crowder | 39 |
| 3 | Davante Adams | 38 |
| 4 | Darren Waller | 37 |
| 5 | Evan Engram | 36 |
A few other notable receivers who saw double digit targets and around 30-percent market share:
- T.Y. Hilton – 11 targets, 31-percent market share
- Jarvis Landry – 11 targets, 31-percent market share
- Stefon Diggs – 11 targets, 29-percent market share
- Cole Beasley – 11 targets, 29-percent market share
- Mike Gesicki – 11 targets, 29-percent market share
- Adam Thielen – 11 targets, 28-percent market share
Carries
Top Carries
| 1 | Dalvin Cook | 32 |
| 2 | Ty Johnson | 22 |
| = 3 | Myles Gaskin | 21 |
| = 3 | Cam Akers | 21 |
| = 5 | James Robinson / Ezekiel Elliott / Nick Chubb / Devin Singletary | 18 |
Carry Market Share (Percentage of Team’s Carry Share)
| 1 | Dalvin Cook | 84 |
| 2 | Derrick Henry | 83 |
| 3 | Myles Gaskin | 75 |
| 4 | Adrian Peterson | 73 |
| 5 | James Robinson | 72 |
Notable additions:
- Benny Snell Jr – 57-percent market share but only 8 carries
- David Montgomery – an unusually low 55-percent market share
- Austin Ekeler – only a 53-percent market share and 8 carries
- Melvin Gordon and Philip Lindsay – 45-percent and 42-percent market shares respectively
- Alvin Kamara – 42-percent market share but 15 carries
- Miles Sanders – only a 40-percent market share
- Taysom Hill, Deshaun Watson, Lamar Jackson, Cam Newton and Russell Wilson – 39-percent, 37-percent, 35-percent, 33-percent and 32-percent market shares
Week 13 Review: Summary
- When Vegas get close with their implied team totals, we can get much closer with the volume projections
- The pass-ratios need some work and, as always, correctly predicting the gamescript is the play
- Refinements to the process are key but the principles remain the same, projecting the team volume is essential to the success of individual player projections
Be ready to adapt, be ready to learn from ‘why’ things happened, and be ready to adjust the ‘what’ for the next round of projections.
A quick look ahead to Week 14’s process has the usual question marks as fatigue kicks in down the stretch, rookies continue to fluctuate, injury replacements have mixed results and coaches are on the hot seat. A few big over/under lines bring some intrigue and high expected returns as Green Bay, Tennessee and Seattle have implied totals over 30, while Philadelphia’s implied total plummets towards Jets territory.
Now, which coaches are going to do something crazy to try and save their job?


