Week 11 Review: Looking Back At Projections
This week’s top random performers were:
- Taysom Hill QB5
- Frank Gore RB13
- Taysom Hill RB1
- Damiere Byrd WR5
- Taysom Hill WR4
- Jordan Akins TE8
- Taysom Hill TE1
Sorry, not sorry…
Predicting these players can be a fools-errand most of the time but what we can do is understand the ‘why’ of what happened so that we have a better chance of predicting the ‘what’ next time around.
As always, I’m not going to spend time working through waiver wire adds, or buy low/sell high candidates, but instead I’m going to take a retrospective look at the assumptions I used for my weekly projections. I’ll pick out where I was significantly different, where I was close, and some of the players that sit at either end of some key stats on the week.
Let’s get into the Week 11 review.
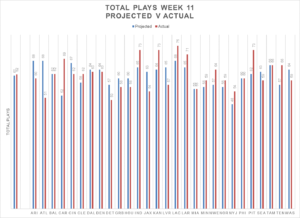
Week 11 Review: Team play counts
Key Stats
- Highest: Los Angeles Chargers (78 plays)
- Lowest: New York Jets / Detroit Lions (55 plays)
- Average: 64 plays
The Facts
- After having one of their lowest play totals of the season in week 10, Los Angeles Chargers topped the pile in week 11
- Kansas City and Indianapolis had their highest of the season while Atlanta had their lowest
- 57-percent of teams are running more than 60 plays (a slight tick down after five weeks of stability at 58-percent) and the average number of plays has been 62 or 63 every week since week 2 (2019 average was 61)
- Only 10 teams hit the over on their Vegas implied totals in week 11 with 71-percent (20 of 28) within one score (up from 64-percent in week 10). 15 teams were within 5 points, 7 teams were within a field goal and 3 teams were 1 out
- The Cowboys dipped below 70 average plays and are once again tied with the Chargers as the team with the highest average with 60.9
- Houston are back to being the team with the lowest average play volume and its New York Jets now giving them a run for their money
The Results
- The average number of plays across the league was just about rights and 25 of 28 teams (89-percent) were within 10 plays (up by four from last week)
- 14 were within 5 plays (down by four), I was 1 out on 2 teams and perfect hits on the Ravens, Dolphins, Eagles and Buccaneers
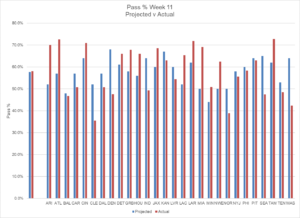
Week 11 Review: Pass Attempts
Key Stats
- Highest: Los Angeles Rams (51 attempts – 72-percent passing)
- Lowest: Cleveland Browns (22 attempts – 35-percent passing)
- Average: 36 pass attempts
The Facts
- Chicago still have the highest average pass rate in the league this season with 65-percent. Jacksonville and Tampa Bay are close behind with 63-percent
- A 68-percent pass rate for Green Bay is their highest of the season while New England followed up week 10’s lowest pass attempts mark with their highest mark (40) in week 11
- Cleveland‘s season-low 33-percent pass rate in week 10 was followed up with a 35-percent pass rate in week 11
- Detroit continue to pass over 60-percent of the time. That’s five weeks in a row having only achieved it once in their first five games
- The lowest average pass rate is held solely by Baltimore with 46-percent, while Cleveland (47-percent), New England (48-percent) and Minnesota (48-percent) are the only other teams below 50-percent
I’m going to keep this note here every week – this metric will always be gamescript driven so the trick is going to be getting that right. The reliance is still on the Vegas over/under and implied team totals to drive my projection totals so getting that right is going to help to get closer.
The Results
- 15 of 28 teams had a pass-ratio within 10-percent of projection (down from 20 last week)
- 7 were less than 5-percent off (down from 12); and 1 within 1-percent
- Closest hit was the Steelers with a 1-percent difference
- Biggest miss for the week was Washington. Whilst Cincinnati struggle in games, I expected them to stay in this one for longer and that Washington would need to throw more
Rush Attempts
Key Stats
- Highest: Cleveland (40 attempts)
- Lowest: Atlanta (14 attempts)
- Average: 26 rush attempts
The Facts
- Nine teams had less than 20 rush attempts in week 11. Whilst that doesn’t sound like a lot, that’s significantly more than most weeks
- Cincinnati’s 18 rush attempts was a joint season low as was Miami’s 17 rush attempts
- Atlanta’s 14 rush attempts was their lowest since week 10 of 2016
Intended Air Yards per Attempt (IAY/A)
Key Stats
- Highest: Joe Flacco (12.7 yards per attempt)
- Lowest: Jared Goff (5.2 yards per attempt)
- Average: 7.9 Intended Air Yards per Attempt
The Facts
- Baker Mayfield’s 11.8 yards is his first double-digit return of the season
- Jared Goff’s 5.2 yards was his lowest since week 1
- Week 10’s biggest story Taysom Hill threw 6.0 IAY/A which was bottom five on the week but higher than Drew Brees has managed in all but two games this season
- Lamar Jackson’s 9.9 yards was his 3rd highest mark of the season
The Results
- 75-percent of QBs were within 2 yards of projection (same as last week)
- 43-percent were within a yard (up from 29-percent)
- 4 QBs within 0.5 yards and Taysom Hill was closest with 0.1 yards
Targets
Top Targets
| 1 | Keenan Allen | 19 |
| 2 | Diontae Johnson | 16 |
| 3 | Robert Woods | 15 |
| 4 | Tyreek Hill | 14 |
| = 5 | Cooper Kupp | 13 |
| = 5 | Antonio Brown | 13 |
Target Market Share (Percentage of Team’s Target Share)
| 1 | Michael Thomas | 52 |
| 2 | Adam Thielen | 39 |
| 3 | Keenan Allen | 37 |
| = 4 | Russell Gage | 35 |
| = 4 | Diontae Johnson | 35 |
A few other notable receivers who saw double digit targets and around 30-percent market share:
- DJ Moore – 11 targets, 32-percent market share
- Curtis Samuel – 10 targets, 29-percent market share
Carries
Top Carries
| 1 | Derrick Henry | 28 |
| 2 | Dalvin Cook | 27 |
| 3 | Jonathan Taylor | 22 |
| 4 | Ezekiel Elliott | 21 |
| 5 | Nick Chubb | 20 |
Carry Market Share (Percentage of Team’s Carry Share)
| 1 | James Robinson | 100 |
| 2 | Dalvin Cook | 93 |
| 3 | Derrick Henry | 82 |
| 4 | Salvon Ahmed | 71 |
| = 5 | Mike Davis / Ezekiel Elliott | 68 |
Notable additions:
- Josh Jacobs – 17 carries and 65-percent market share
- Antonio Gibson – 16 carries but less than 50-percent market share
- Denver – Lindsay 48-percent market share; Gordon 45-percent market share
- Alvin Kamara – only 36-percent market share
- Tampa Bay – Jones 56-percent market share; Fournette 39-percent market share
- Aaron Jones – only 56-percent market share (52-percent last week)
- Russell Wilson – a massive 40-percent market share
- Taysom Hill – 28-percent market share – RB eligible?!
Week 11 Review: Summary
- When Vegas get close with their implied team totals, we can get much closer with the volume projections
- The pass-ratios need some work and, as always, correctly predicting the gamescript is the play
- Refinements to the process are key but the principles remain the same, projecting the team volume is essential to the success of individual player projections
Be ready to adapt, be ready to learn from ‘why’ things happened, and be ready to adjust the ‘what’ for the next round of projections.
A quick look ahead to Week 12’s process again flags some Quarterback unknowns with the likes of Cincinnati and Jacksonville changing the man under centre. A view tasty Vegas over/unders give us something to shoot at but the impact of Covid-IR and injuries are continuing to plague the league.
Are we finally going to get a week of games without weather playing a big part? That would be nice!


