Week 10 Review: Looking Back At Projections
This week’s top random performers were:
- Daniel Jones QB8
- Rex Burkhead RB6
- Cole Beasley WR1
- Cameron Brate TE4
Predicting these players can be a fools-errand most of the time but what we can do is understand the ‘why’ of what happened so that we have a better chance of predicting the ‘what’ next time around.
As always, I’m not going to spend time working through waiver wire adds, or buy low/sell high candidates, but instead I’m going to take a retrospective look at the assumptions I used for my weekly projections. I’ll pick out where I was significantly different, where I was close, and some of the players that sit at either end of some key stats on the week.
Let’s get into the Week 10 review.
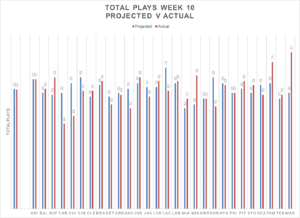
Week 10 Review: Team play counts
Key Stats
- Highest: Washington Football Team (83 plays)
- Lowest: Carolina Panthers (47 plays)
- Average: 64 plays
The Facts
- Los Angeles Chargers had their lowest play total since week 4 while Washington ran above 80 plays for the first time since an OT game in 2016
- Tampa Bay contrasted week 9’s season low with week 10’s season high, and both New Orleans and Chicago had their lowest of the season
- 58-percent of teams are still running more than 60 plays (that number has been stable for five weeks in a row now) and the average number of plays has been 62 or 63 every week since week 2 (2019 average was 61)
- Only 13 teams hit the over on their Vegas implied totals in week 10 with 64-percent (18 of 28) within one score (down from 75-percent in week 9). 10 teams were within 5 points, 6 teams were within a field goal and Carolina was 1 out
- The Chargers dipped below 70 average plays so the Cowboys maintain the highest average with 70.7
- And with Minnesota leaving week 10 with 69 plays, their average has jumped up and Houston are back to being the team with the lowest average play volume
The Results
- The average number of plays across the league was spot on and 21 of 28 teams (75-percent) were within 10 plays (up by one from last week)
- 18 were within 5 plays (up by six), I was 1 out on 3 teams and perfect hits on the Cardinals, Patriots and Eagles
Week 10 Review: Pass Attempts
Key Stats
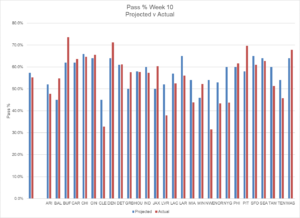
- Highest: Washington Football Team (55 attempts – 68-percent passing)
- Lowest: New England Patriots (18 attempts – 32-percent passing)
- Average: 34 pass attempts
The Facts
- Chicago still have the highest average pass rate in the league this season with 65-percent. Without the games Trubisky started, it’s at 68-percent
- A 74-percent pass rate for Buffalo is their highest of the season while 49 pass attempts marks a career high for Josh Allen, with over 40 attempts in 4 games now this season
- New Orleans didn’t have their lowest pass rate but they did have their lowest pass attempts since week 17 of 2018 with 23
- Similarly, New England‘s 18 pass attempts is their lowest since week 17 of 2008
- Cleveland‘s 33-percent pass rate is also their lowest of the season so far, but we can blame the weather again there
- Detroit continue to pass over 60-percent of the time. That’s four weeks in a row having only achieved it once in their first five games
- The lowest average pass rate is a tie between Baltimore and New England with 46-percent, while Cleveland and Minnesota are the only other teams below 50-percent
I’m going to keep this note here every week – this metric will always be gamescript driven so the trick is going to be getting that right. The reliance is still on the Vegas over/under and implied team totals to drive my projection totals so getting that right is going to help to get closer.
The Results
- 20 of 28 teams had a pass-ratio within 10-percent of projection (up from 12 last week)
- 12 were less than 5-percent off (up from 6); and 2 within 1-percent
- Closest hit was the Lions with only a 0.1-percent difference
- Biggest miss for the week was New England. I projected a low pass rate but nowhere near as low as they got
Rush Attempts
Key Stats
- Highest: Las Vegas / Cleveland (41 attempts)
- Lowest: Carolina (16 attempts)
- Average: 27 rush attempts
The Facts
- After eight teams had less than 20 rush attempts in week 9, it was back down to only four in week 10
- New York Giants 36 rush attempts was a season high following 35 attempts in week 9
- And after Tampa Bay hit an all time NFL record for the lowest rush attempts in week 9, they bounced back with their highest since week 7 of 2016 (37)
Intended Air Yards per Attempt (IAY/A)
Key Stats
- Highest: Tua Tagovailoa (10.6 yards per attempt)
- Lowest: Drew Brees (3.5 yards per attempt)
- Average: 7.3 Intended Air Yards per Attempt
The Facts
- This week’s non-QB taking the top of the charts was Jakobi Meyers (did the broadcast mention he used to be a Quarterback??)
- 4.9 yards is Philip Rivers’ lowest since week 5 of 2019
- Meanwhile, Drew Brees’ 3.5 yards is low even by his standards. Imagine how he’d go low that would be if he was throwing with broken ribs…
The Results
- 75-percent of QBs were within 2 yards of projection (same as last week)
- 29-percent were within a yard (down from 32-percent)
- Only 2 QBs within 0.5 yards and none better than 0.3 yards out (Tom Brady)
Targets
Top Targets
| 1 | JD McKissic | 15 |
| 2 | Brandon Aiyuk | 14 |
| = 3 | Cole Beasley | 13 |
| = 3 | JuJu Smith-Schuster | 13 |
| = 5 | DeAndre Hopkins | 12 |
| = 5 | Davante Adams | 12 |
Target Market Share (Percentage of Team’s Target Share)
| 1 | Jakobi Meyers | 41 |
| 2 | DeAndre Hopkins | 38 |
| = 3 | Davante Adams | 36 |
| = 3 | Brandon Aiyuk | 36 |
| 5 | Alvin Kamara | 35 |
A few other notable receivers who saw double digit targets and around 30-percent market share:
- Mike Evans – 11 targets, 29-percent market share
- Justin Jefferson – 10 targets, 31-percent market share
- Marvin Jones – 10 targets, 31-percent market share
- Josh Reynolds – 10 targets, 28-percent market share
Carries
Top Carries
| 1 | Dalvin Cook | 30 |
| = 2 | James Robinson | 23 |
| = 2 | Ronald Jones | 23 |
| 4 | Damien Harris | 22 |
| = 5 | Josh Jacobs / Salvon Ahmed | 21 |
Carry Market Share (Percentage of Team’s Carry Share)
| 1 | James Robinson | 100 |
| 2 | Dalvin Cook | 91 |
| 3 | D’Andre Swift | 76 |
| 4 | Jerick McKinnon | 72 |
| 5 | Cordarrelle Patterson | 71 |
Notable additions:
- Derrick Henry – 19 carries but only 59-percent market share
- Denver – Melvin Gordon 58-percent market share; Phillip Lindsay 21-percent market share
- Aaron Jones – only 52-percent market share
- Cleveland – Nick Chubb and Kareem Hunt both with 46-percent market share
- Mike Davis – only 44-percent market share despite the CMC injury
Week 10 Review: Summary
- When Vegas get close with their implied team totals, we can get much closer with the volume projections
- Certain teams are starting to change the way they play with the likes of the Lions passing more and the Giants running more
- Refinements to the process are key but the principles remain the same, projecting the team volume is essential to the success of individual player projections
Be ready to adapt, be ready to learn from ‘why’ things happened, and be ready to adjust the ‘what’ for the next round of projections.
A quick look ahead to Week 11’s process flags some huge unknowns at the Quarterback position as injury replacements make it tough to predict their impact on the team approach. The Vegas over/unders are concentrated too so this could be a week of very close projections across the board.
So is Mr Winston going to fit in to the New Orleans style of Quarterback play or will he not be able to help himself from throwing 17 interceptions?


