Wide receiver is arguably the most important position to get right in on DraftKings. Players start a minimum of three, frequently four in tournaments. It’s also one of the hardest positions to get right. Volume is much easier to predict than with running backs and quarterbacks. This is the third part of a series recapping the 2019 season on DraftKings. Who was valuable? Who wasn’t? How did scoring trends compare to prior years? Let’s dive in.
2019 DraftKings Recap Wide Receiver Performances
Most Valuable Player: DeVante Parker, MIA
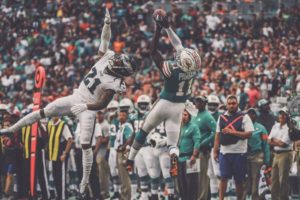 Lamar Jackson and Christian McCaffrey were obvious choices for MVP. Both led their position in scoring, by a wide margin. There was a player who led all WRs in scoring by a wide margin as well, but we’ll touch on him in a bit. DeVante Parker, who was only the WR11 by total DraftKings scoring and led the position in-season value thanks to an average salary of just $5k. Parker was outscored by players like DeAndre Hopkins and Julio Jones by 20+ points but on an average salary of $2700 cheaper. His lower price allowed lineups to use him as a WR2 and stack higher-priced players and still deliver consistent value.
After spending the first 11 weeks of the season with a price below $5k, Parker’s price reached the $7k range by the end of the season. That didn’t stop him from returning salary-adjusted value, though. Parker registered eight 3x performances, second-most of all WRs. Three of those came in the final three weeks of the season. His top performance, a 37.9 pt outing on $5.7k salary, was a tournament winner across the slate.
Runner Up: Michael Thomas, NO
 Michael Thomas was far and away the most reliable WR option on DraftKings in 2019. Thomas posted a 3x value nine times to lead the position. He lagged when it came to delivering tournament value, though. Thomas hit 4x value just twice in 2019 due to his consistently high price, he only spent three weeks with a price below $7.8k. Only two WRs hit 4x value in a week they were priced higher than that: Hopkins Week 1 (price: $8.2k, 34.1 points) and Thomas Week 14 (price: $8.3k, 33.4 points).
Overall, Thomas’ 2019 season total of 404.6 DK points outscored second-place Chris Godwin by an incredible 111 points. The gap between WR1 Thomas and WR2 Godwin was the same as the gap between Godwin and WR33 D.K. Metcalf. Thomas’s season ranks third among all WR seasons on DraftKings, behind 2015 and 2014 Antonio Brown, respectively.
Honorable Mention: Deebo Samuel, A.J. Brown.
Least Valuable Player: Juju Smith-Schuster, PIT
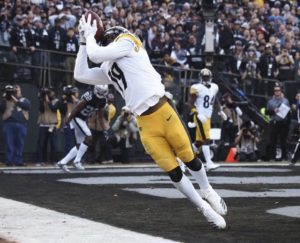 After a 2018 sophomore campaign that saw Juju Smith-Schuster finish as the overall WR8 on DraftKings—a season in which he turned just 22 years old—the fantasy world was ready to see what he would do as he took over as Pittsburgh’s WR1. However, a Week 2 injury to Ben Roethlisberger left Juju’s QB situation shaky-at-best. Mason Rudolph and Devlin Hodges took turns struggling throughout the rest of year. In addition, Juju’s own injury problems condemned him to a season of ineffectiveness.
44 WRs had an average price of at least $5k in 2019 and Juju’s season value of 1.52 was the worst of any of them. His best week of the season was a 24.3-point outing in a game Pittsburgh was 14-point favorites over a Miami defense that was generous to WRs all year. After a 2018 in which he went over 100 yards in half his games, this was his only time doing so in 2019.
Runner Up: Marquez Valdes-Scantling, GB
 Marquez Valdes-Scantling started the year as the de-facto second option in the Green Bay passing game after a year in which he emerged over two rookies and Geronimo Allison. Expectations weren’t too high to start off 2019: his salary was just $4.4k in Week 1. However, he saw 5+ targets as GB’s WR2 in each of the first four games. He also saw 77%+ of snaps in Weeks 2-6. His playing time began to decrease in Week 7, but that was hidden by his second 4x performance of the season in which he took two receptions for 133 yards and two TDs.
After that game, Scantling caught just five more balls for the rest of the season. He was supplanted by Allen Lazard as the Packers’ WR2. His price eventually bottomed out at $3k in Week 16, but not before he killed fantasy players with performances of 1.4, zero, and zero points on $5k, $5.6k, and $4.5k salaries in Weeks 8-10. On the season, despite playing every game, Scantling posted double-digit performances just twice.

Dishonorable Mention: Odell Beckham Jr., Adam Thielen
Wide Receiver Scoring in 2019
Trends
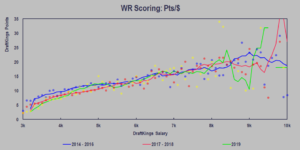
The above graph breaks historical WR scoring into three groups: 2014-2016, 2017-2018, and 2019. We did this in Part 1 because 2017 marked a stark change in the way DraftKings priced QBs. For RBs and WRs, we don’t have the same change in the process. Cheap WRs (sub-$5k) seemed to consistently score a bit higher from 2014-2016 than 2017-2019. Overall, there isn’t a meaningful statistical difference between the two groups, so we’ll be able to compare 2019 to all of 2014-2018.
Immediately, we see the noise at the far right of the graph. In total, we have 337 WR weeks priced above $8k across the six-year sample or 56 per year. However, that number dropped off dramatically in 2019: 319 of those weeks were in 2014-2018, or 64 per year and just 18 were in 2019. For the rest of this piece, we’ll cut the graphs off at 8k and focus on the high-priced guys here.
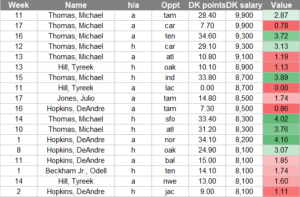 Here we see a very similar pattern to the one we saw with running backs where high-priced RBs not named McCaffrey crashed and burned. Of the seven 3x performances here, five of them are Thomas. In fact, the weighted average value by non-Thomas receivers priced above $8k was just 1.74 (1.92 if you remove Tyreek Hill’s Week 11 when he left early in the game due to injury).
Hill’s inclusion at all on this list—let alone three appearances—sticks out. Hill scored just 194 DK points on the season; fewer then Jamison Crowder and Deebo Samuel. However, his three appearances on this list are more than the overall WR2 Chris Godwin (zero), WR3 Julio Jones (one), and WR4 Cooper Kupp (zero) combined. Hill only hit 4x value twice in 2019 (including his Week 9 when he technically fell 0.1 points short), but they came consecutively in Weeks 9 and 10.
Still, Hill’s inclusion on this list compared to a guy like Godwin is interesting. Godwin scored 44.2, 34.5, and 28.1 points in Weeks 4-6 (all 4x performances). However, his price only reached $7.1k for his next matchup in Week 8. Similarly, Cooper Kupp scored 36.2, 29.9, and 29.7 points in Weeks 3-5 but only hit $7.1k in Week 6. The takeaway here may be that first-half season pricing may be more sticky to prior season performance than hot streaks.
Splits
There are two generally accepted rules in fantasy football. First, is that everything else equal, players score better at home than they do on the road. Second, players on favored teams score better than those on underdogs. These rules are both intuitive and empirically proven.
In daily fantasy, raw scoring is less important than price-adjusted scoring. If the advantage that a player gains from being at home is baked into a higher price, then we don’t gain any value by playing players at home. The following two graphs will look at the scoring splits between home and road performances. Also, show whether or not prioritizing home or favored players paid off in 2019. The green lines represent scoring from 2014-2018, and blue lines represent scoring in 2019, while the dark lines represent home (and favorite) scoring, and the lighter lines represent road (and underdog) scoring.
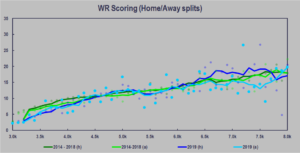
Contrastingly with the QB and RB home/away splits, the WR position has a visible gap between home/road scoring. While the green lines for 2014-2018 are pretty close together throughout the graph, the 2019 home average is above the road average for all of $6k through $7.7k. This is the first statistically significant home/away edge we’ve seen so far with gaps of over three ppg from $6.7k – $6.9k and $7.3k – $7.7k over a sample of 152 home weeks and 166 road weeks.
The dip at $7.5k for road WRs has a sample of 32 players who averaged just 13.05 ppg. Over this group, there were more sub-1 value performances (eight) than 2.5+ value performances (five). On the other hand, the 30 home WRs here averaged 19.11 ppg, with just three sub-1 value performances and 12 3x performances. At $6.7k, there were 42 road WRs that averaged just 14.42 ppg, compared to 40 home WRs that averaged 18.67. Interestingly, there were nearly as many 4x performances (eight road, nine away). There is a huge gap in performances with a value between three and four, just two road and 13 home. This indicates home wide receivers were much at this price point in 2019.
However, this trend doesn’t extend lower than this where overall scoring was level. In fact, at $5.6k, there was a negligible difference overall between home (11.56 ppg) and road (11.64) WRs. Road WRs had a marginally better rate of producing 3x performances (13/63 = 21%) than home WRs did (9/57 = 16%).
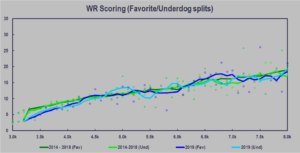 The favorite/underdog graph represents a divergence from what we saw with QBs and RBs, as well. Where those positions showed fluctuations resulting in one line having a clear edge over the other, the WR graph is remarkably boring.
The biggest gap on the graph in 2019 scoring is at $6.9k. Favored WRs outscored underdogs by 3.04 ppg (17.13 – 14.09). However, on this graph, that point is a much bigger dip from the points around it, with the scoring at $6.7k and $7.1k at 15.81 and 16.81 points, respectively, whereas on the home/away graph, those points were 14.42 and 15.11, which are lower by 1.4 and 1.7 points, respectively.
Unfortunately, there’s not much more to be gleaned from favorite/underdog splits. DraftKings did a comparatively good job preventing edges from being gained. They picked players based on betting spread for WRs in 2019; targeting home players was a more effective strategy.


