2019 DraftKings Recap: Running Backs, Trends, And Strategy
Running backs don’t matter. At least, that’s the trendy train of thought that has been driven, in part, by the rise of analytics in recent years. Play-by-play data shows running the ball is less efficient than throwing, and the effectiveness of different running backs on the same teams is small. Volume is the great differentiator.
This applies to daily fantasy as well: volume is king. It’s why injury-replacement backups are chalk. The predictability of volume makes investment in high-priced RBs less risky than other positions.
This is Part Two of a series recapping the 2019 season on DraftKings. Who was valuable? Who wasn’t? How did scoring trends compare to prior years? Let’s dive in.
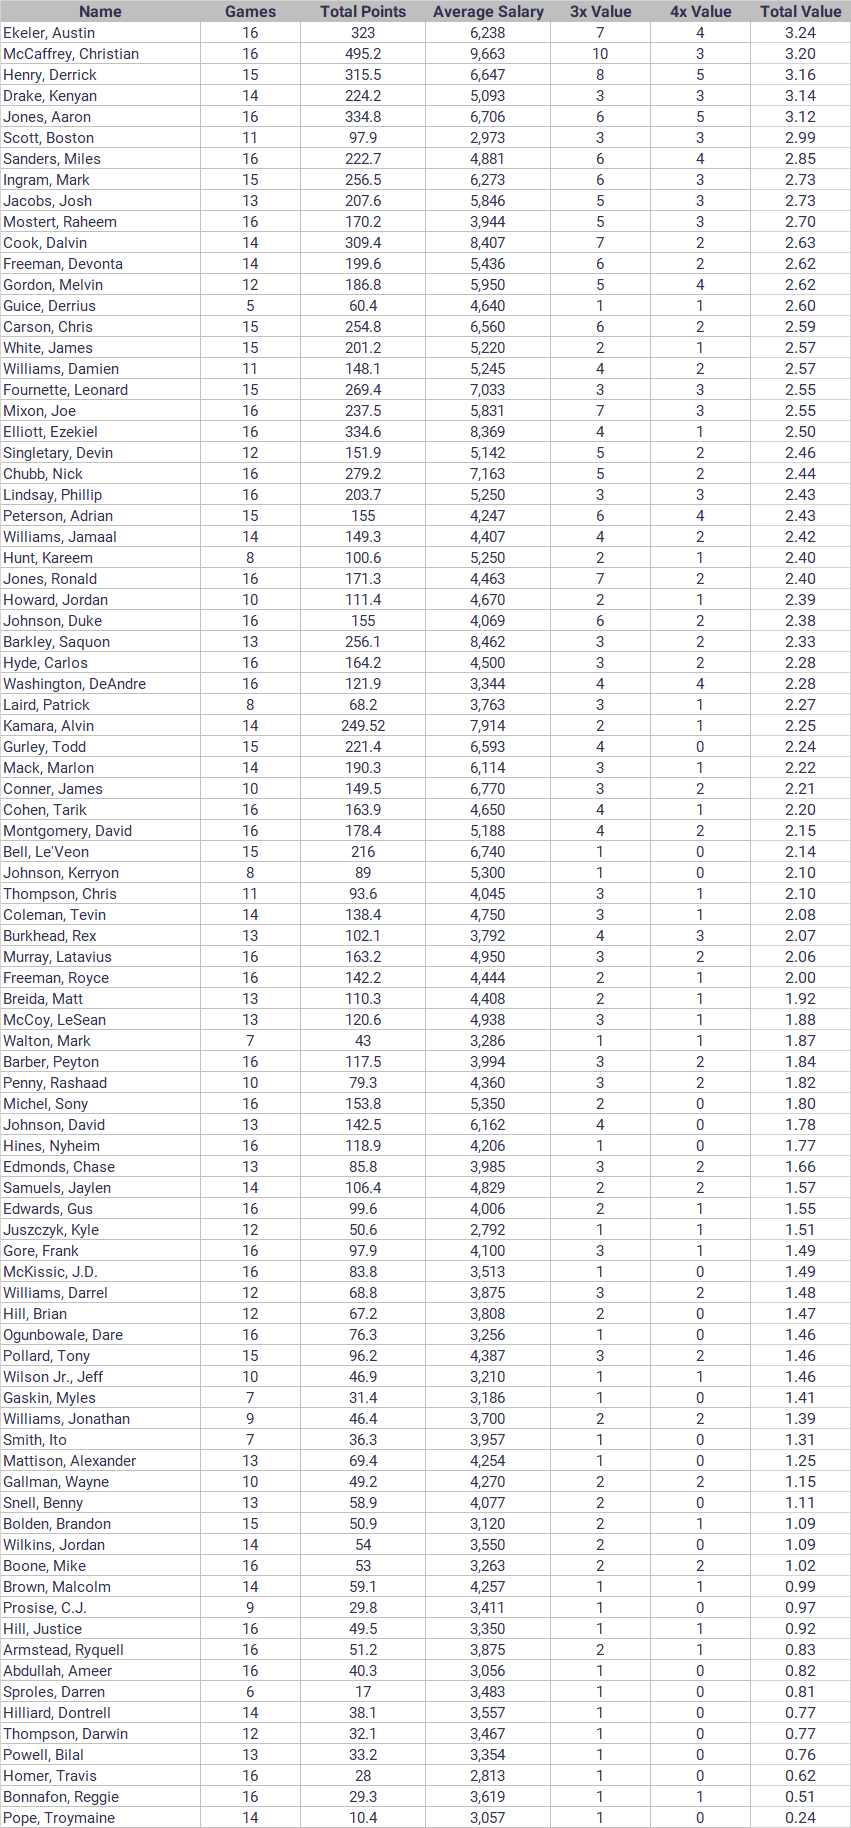
Most Valuable Player Christian McCaffrey, CAR

Cash lineup construction in 2019 started with two questions: Is Christian McCaffrey on this slate? If yes, do I pay up for him? If you answered “Yes”, to both those questions, you had the foundation for a good week. McCaffrey hit 3x value in a league-leading 10 games, and even that undersells how consistently great he was: two of his six sub-3x performances were off the main slate, and two more games were 29.1 and 24.5 point efforts that still gave your lineup a fighting shot.
Christian McCaffrey And The Top 5 Dynasty RBs for 2020
McCaffrey’s season value of 3.20 was all the more impressive given an average salary $1,200 higher than any other back. On DraftKings full PPR format, McCaffrey added the 2nd-most receptions in the NFL and 1,000 receiving yards to the 2nd-most rushing fantasy points in the league. Those numbers led to McCaffrey not just having the best RB DraftKings season of all time, but passing 2nd-place 2016 David Johnson’s mark of 425.8 by nearly 70 points.
Runner Up: Derrick Henry, TEN

I spent most of 2019 advising against playing Derrick Henry. For the first half of the season, that was good advice: After putting up 28 points in Week 1, Henry wouldn’t hit the 20-point mark again until Week 9. DraftKings’ PPR scoring just doesn’t offer backs that don’t catch the ball the same scoring potential as backs like McCaffrey and Austin Ekeler – the two backs who lead the league in season value – to generally be appealing to me as a cash play.
However, Henry does get the nod over Ekeler for this spot. Starting in Week 9, he turned his season around. In seven games, Henry rushed for 916 yards and 11 touchdowns. He hit the 100+ yard bonus in five games and scoring multiple touchdowns in four. And thanks to his price being sticky for the first couple weeks of his explosion (staying low due to his early-season disappointments), he returned massive value for players who kept their faith in him. On the season, Henry racked up eight 3x performances, second to McCaffrey, and five 4x performances, tied for the league lead with Aaron Jones. Those who rode Henry’s hot streak into the playoffs were rewarded as well, with 377 yards and a TD in two Tennessee wins.
Honorable Mention: Austin Ekeler, Aaron Jones
Least Valuable Player: Sony Michel, NE

As the lead back on a New England team that was favored in all 16 regular-season games, the stars seemed to be aligned for Michel to be a profitable back on DraftKings. Michel got the role people expected; Carrying the ball 15 times per game and racking up 180 more carries than the next-closest New England back. But, he never capitalized on the opportunity. Michel never once rushed for 100 yards in a game. He scored just seven TDs on the season, three of which came in a single game that wasn’t even on the main slate. Michel then followed that performance up with six consecutive weeks of single-digit DraftKings output.
His low price kept him tempting – getting his guaranteed volume at ~$5k is rare on DraftKings – but Michel was fool’s gold all season.
Runner Up: Le’Veon Bell, NYJ

The return of Le’Veon Bell from a year-long absence had DFS players excited for 2019. Bell spent the 2017 season with a salary above $9k in 13 of 15 weeks, but opened up 2019 at just $7.1k. He hit 3x value in Week 1 and looked poised to carry DFS lineups once again. But, he didn’t hit that mark for the rest of the season. Bell rushed for just 3.2 yards per carry and only found the end zone four times. What kept him more valuable than Michel was his higher floor in PPR scoring; his receiving work kept him in double-digit scoring in all but two games. Whereas Michel was under ten points nine times in 2019. Bell didn’t have any slate-winning weeks, but he at least rarely cratered a lineup.
Dishonorable Mention: David Johnson, David Montgomery
RUNNING BACK SCORING ON DRAFTKINGS, 2019
2019 Trends
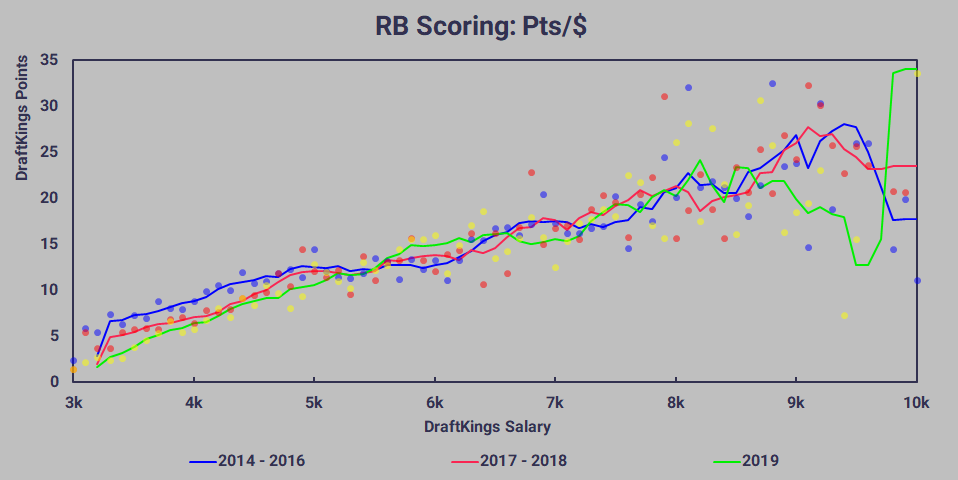
The above graph breaks historical RB scoring into three groups: 2014-2016, 2017-2018, and 2019. We did this in Part One because 2017 marked a stark change in the way DraftKings priced QBs. For RBs, we don’t have the same change in process. Cheap RBs (sub-$5k) seemed to consistently score a bit higher from 2014-2016 than 2017-2019. But overall, there isn’t a meaningful statistical difference between the two groups, so we’ll be able to compare 2019 to all of 2014-2018.
Two things that immediately catches the eye on this graph are the 2019 dip at $8.9k and spike at $9.8k. The reason for the spike is obvious; that’s “Christian McCaffrey Range”. All seven weeks of a RB being priced at $10k and up were McCaffrey, and as we already talked about, he consistently smashed no matter what price he was. What’s more interesting is the dip: almost every single RB priced at $8.9k and above crashed and burned.
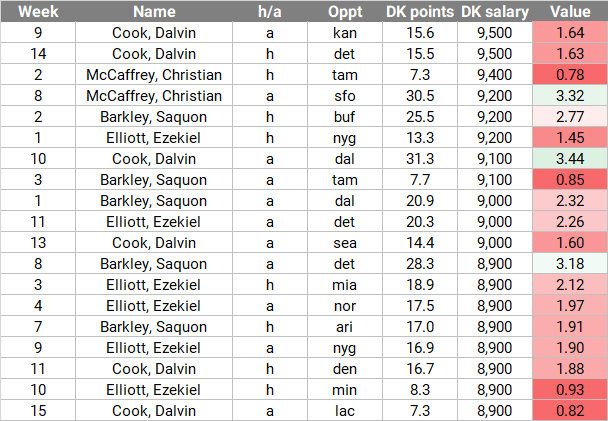
That’s a lot of red. Of course, there’s likely nothing useful to be gleaned from this data. Even with the benefit of retrospect, there’s no reason to believe that Dalvin Cook and Zeke Elliott in smash spots at home against Detroit and Miami should have been priced any lower. In fact, the one thing that this chart does is highlight the difference between McCaffrey and the rest of the position in 2019. Of course, the players on this list were more than capable of hitting value at these prices, they just had too much bust potential. The gap between McCaffrey and the No.2 back in Week 1 of the 2020 season will be interesting to see.
Splits
Two of the generally accepted rules of fantasy football is that, everything else equal, players score better at home than they do on the road and players on favored teams score better than those on underdogs. These rules are both intuitive and empirically proven.
But in daily fantasy, raw scoring is less important than price-adjusted scoring. If the advantage that a player gains from being at home is baked into a higher price, then we don’t gain any value by playing players at home. The following two graphs will look at the scoring splits between home and road performances, and whether or not prioritizing home or favored players paid off in 2019. The green lines represent scoring from 2014-2018. The blue lines represent scoring in 2019. And the dark lines represent home (and favorite) scoring, while the lighter lines represent road (and underdog) scoring.
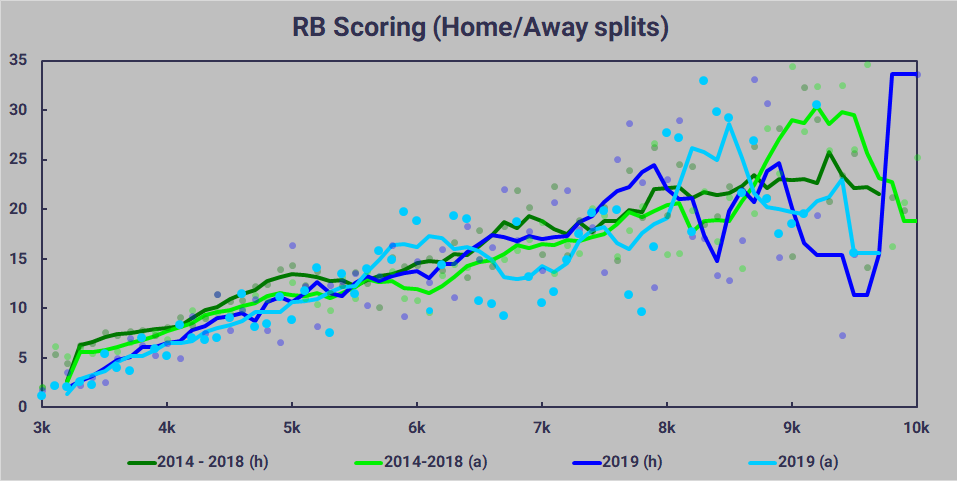
Once again, the drop at $9k sticks out, but there’s another notable spot on this graph. The home RB line in 2019 is pretty steady up to $8.1k, where there’s a massive drop between $8.1k and $8.7k. Contrastingly, road RB performances spike between those points. Granted road RB performances are highly variable throughout the grap—the line is higher from $5.7k to $6.6k than it is at any point from $6.7k to $7.2k, for example—but this spike is notable in that it’s mirrored by a drop in the home scoring.
Now Available: YPF T-Shirts, Hats, & Hoodies!
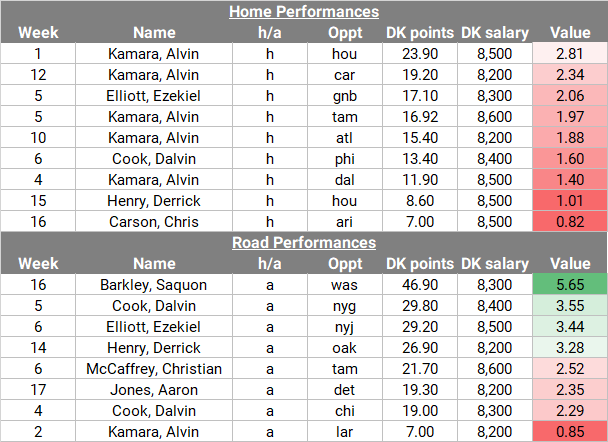
The sample is interesting in that the group is diverse. Eight different names make up the 17 entries—albeit Alvin Kamara is six of them—and the opponent list has 15 different teams. The majority of the list of poor performances in home games feature bottom-third run defenses (Washington, Green Bay, Houston, Carolina), whereas the good performances in road games were against more top-third run defenses (New York Jets & Giants, Tampa Bay). This likely just indicates a quirk in data; it’s hard to say even with hindsight that the home players should have been priced lower; Derrick Henry was coming off of five straight games of 24.9+ points. Zeke Elliott was already $600 cheaper than his previous week. Alvin Kamara was a 10-point favorite against the league’s worst run defense. Dalvin Cook was coming off nearly 30 points against the Giants.
On the other side it’s tough to say the road players should have been priced higher. Zeke got a $200 price *increase* after stumbling against Green Bay and still hit value against the Jets. Saquon was already $1000 more expensive than he had been two weeks prior, and was coming off of four sub-15 point performances in his last five games. This just doesn’t strike me as having actionable significance.
It’s Dynasty Season! Check Out Our Latest Dynasty Content!
There’s also a notable bump in the 2014-2018 away performances at high prices. The 36 road RB weeks from $9k to $9.5k averaged around 28-30 ppg. 24 of them (66%) went for 25+. The 33 home RB weeks in that range, on the other hand, hit 25+ points 16 times, and averaged 22-23 points.
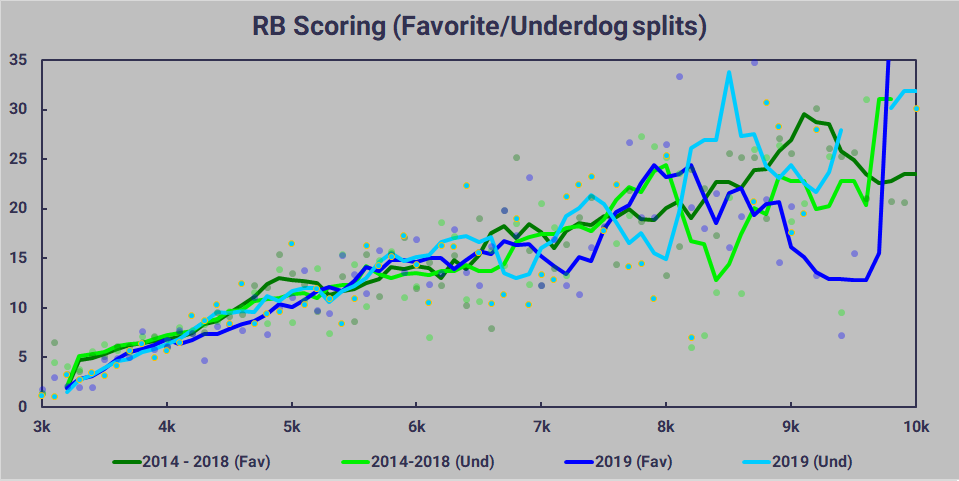
Like the home/away graph, the favorite/underdog graph has a spike by the disadvantaged group. And as was the case with quarterbacks in 2019, the culprit is small sample size. The spike at $8.5k comes from just two data points:
- Saquon Barkley Week 16: Price: $8,300, 46.9 points
- Saquon Barkley Week 17: Price: $8,700, 20.7 points
In fact, there were only 12 underdog RBs priced between $8k and $10k in 2019. There were 35 favored RBs (and seven of those 12 were Saquon Barkley). That list of 47 total weeks is made up of nine names. Both of these splits make sense; we would expect a correlation between price and being favored, and a limited number of backs worth a high price. However, it doesn’t seem that price fluctuates with betting line. At least, not in a way that is discernable from fluctuations due to matchup.
Check Out Our 2020 Rookie Profiles!
Zeke Elliott’s five lowest prices of the season came in six of the weeks the Cowboys were less than 3.5-point favorites. But, those matchups were BUF, @NE, LAR, @PHI, and @CHI. All five teams were top-12 in overall DVOA, and the lowest (PHI) was fourth in rush DVOA. Dalvin Cook’s three sub-$8k prices were the first three weeks of the season, before his price caught up to his “true” value. Alvin Kamara’s four lowest prices of the season were all games the Saints were favored; his price was reduced due to matchups (IND, SF, @TB, @TEN).
Even the overall trend is hard to see; scoring in 2019 doesn’t reveal any pattern or advantage to be had by targeting favored backs, as we saw with QBs.


