2019 DraftKings Recap: Quarterbacks, Trends, And Strategy
Passing is king in the NFL in 2019. Ten (10) of the top 13 quarterbacks in DVOA led their teams to the playoffs in 2019 (albeit two of them, Drew Brees and Teddy Bridgewater, played for the same team). It’s a quarterback’s league, and if you don’t have one, it’s tough to win.
Fantasy football, however, doesn’t place the same value on quarterbacks as real football. The inflation of passing stats has meant that acceptable fantasy production can be found in the middle-to-late rounds of fantasy drafts, or in the case of daily fantasy, lower prices. However, that doesn’t mean that quarterback isn’t an important part of a player’s lineup. Quarterbacks score more points/dollar than other positions, so getting the position right is vital.
This is Part 1 of a series recapping the 2019 season on DraftKings. Who was valuable? Who wasn’t? How did scoring trends compare to prior years? Let’s dive in.
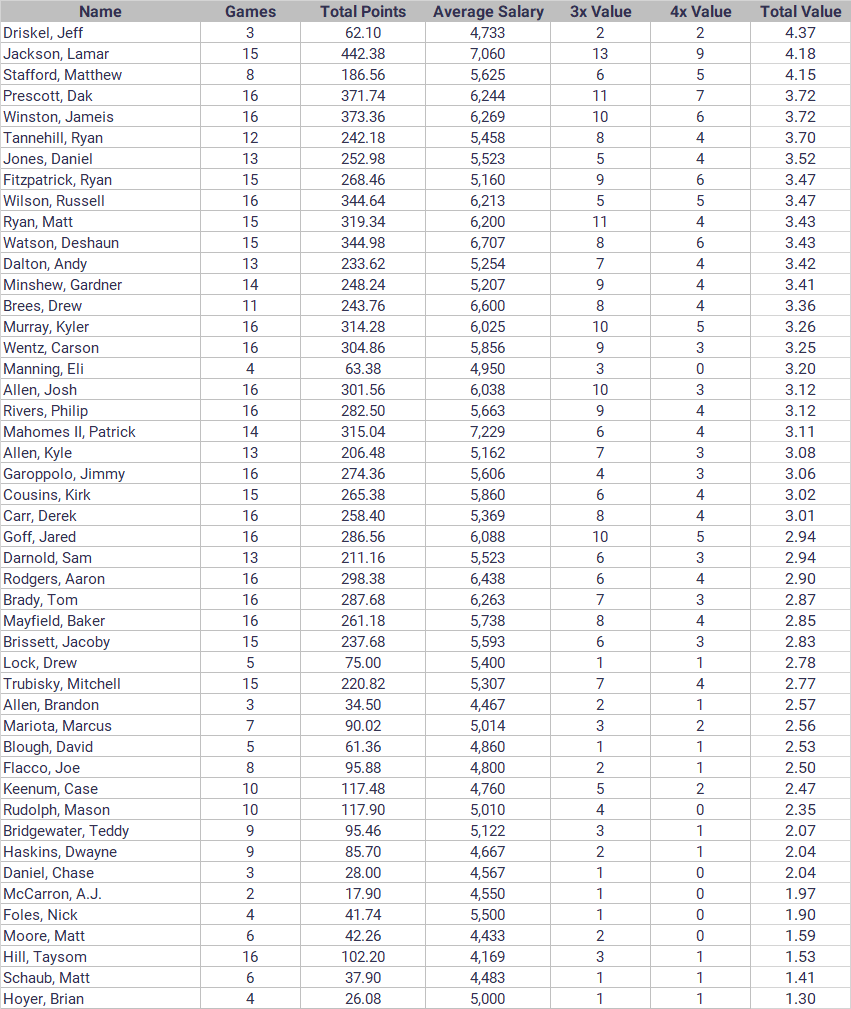
Most Valuable Player: Lamar Jackson, BAL

Lamar Jackson was a revelation in 2019, turning in a fantasy season that trailed only Patrick Mahomes’ 2018 among quarterbacks. DraftKings couldn’t price him high enough, finally getting him up to $8k for his final game in Week 16. Overall on the season, Jackson’s 442.38 points gave him a weighted average valueof 4.18. He hit 3x value in 13-of-15 starts, only falling short in road games against Buffalo and Pittsburgh, and hit 4x value nine times. From Week 6 on, he only failed to hit 25 DK points once.
Runner Up: Matthew Stafford, DET

Matthew Stafford only turned in half a season in 2019 after fracturing a bone in his back, but was one of the best QBs on DraftKings in those eight games. Stafford hit 3x value in six games and 4x value in five. His 62.5% rate was the best in the league. As an added bonus, Jeff Driskel, his replacement, actually turned in the best weighted average value with 4.37, hitting 4x value in two of his three games.
Honorable Mention: Dak Prescott, Jameis Winston
Least Valuable Player: Mitchell Trubisky, CHI

In 2018, Mitchell Trubisky finished his sophomore year as the overall QB15. Going into his third year – second with WR Allen Robinson and HC Matt Nagy – there were reasons for optimism. That optimism turned out to be unfounded, as Trubisky turned in the worst value season of any QB who started at least 11 games at 2.77. He hit 3x value in just seven appearances, and 4x in four. In the first 11 weeks(9 games), he never exceeded 21 points and had single digits in five outings. He did find a groove late in the season, scoring 20+ in four-straight games from Weeks 12-15.
Runner Up: Baker Mayfield, CLE

Another victim of high expectations, Baker Mayfield actually scored 40 more DK points than Trubisky in 2019. But, his season value of 2.85 was only marginally better due to an average salary that was $400 higher. Mayfield put up just one more 3x value performance than Trubisky with eight, and matched him in 4x performances with four. One thing that made Mayfield a better value than Trubisky was his higher floor. He only posted single digits once–a road matchup with San Francisco that he was heavily faded in anyway. That being said, he flopped in a lot of spots where people were high on him. The most notable coming in Week 14 versus Cincinnati when he scored just 12.98 points on a $6,300 salary.
Dishonorable Mention: Mason Rudolph, Case Keenum
Quarterback Scoring on DraftKings, 2019
2019 Trends
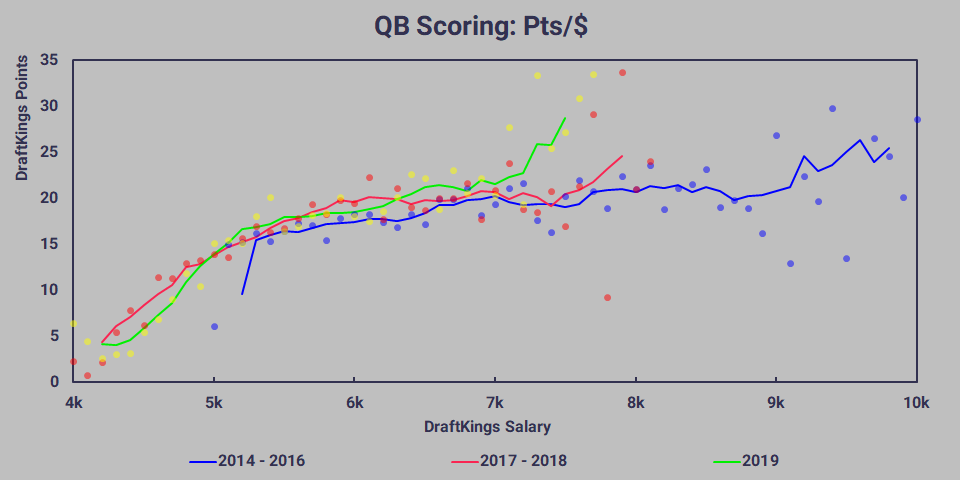
The above graph breaks historical QB scoring into three groups: 2014-2016, 2017-2018, and 2019. We do this because 2017 marked a stark change in the way DraftKings priced QBs. This is evident from the difference between the red and blue lines on the graph. The minimum price was lowered from $5k to $4k, and the top prices were lowered as well. From 2014-2016, there were 230 QB weeks priced at $7.5k and up, including 120 at $8k and up. In 2017, there were 17 QB weeks priced at $7.5k and up (and just four above $8k). In 2018 there were just two.
So for quarterbacks, we only have two years of prior data to reliably compare to. Still, the difference between the green and red lines is pronounced above $7k. QBs priced above that mark killed it in 2019. Of the 19 QB weeks priced above $7k, nine hit 4x value, including five of the eight priced at $7.5k and up.
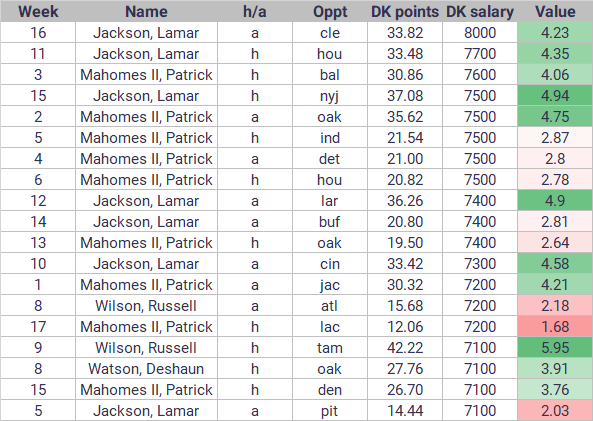
An interesting takeaway from this table is the relatively even splits. The high-priced weeks are split between 10 home and nine away. They are relatively balanced throughout the season, with nine entries from Weeks 1-8 and 10 from Weeks 9-17.
At salaries below $7k, differences are negligible. While 2019 averages are higher than priors at all prices above $6,300, the differences are largely within the margin of error. However, I would expect to see the $7k spike flattened out in 2020. DraftKings will be less hesitant to price top QBs above $7.5k, which they only did three times in 2019
2019 Splits
Two of the generally accepted rules of fantasy football are that, with everything else equal, players score better at home than they do on the road, and players on favored teams score better than those on underdogs. These rules are both intuitive and empirically proven.
But in daily fantasy, raw scoring is less important than price-adjusted scoring. If the advantage that a player gains from being at home is baked into a higher price, then we don’t gain any value by playing players at home. The following two graphs will look at whether or not the splits between home and road performances and splits between underdog and favored players paid off in 2019. The green lines represent scoring from 2017-2018, and blue lines represent scoring in 2019.The darker lines represent home (and favorite) scoring. The lighter lines represent road (and underdog) scoring.
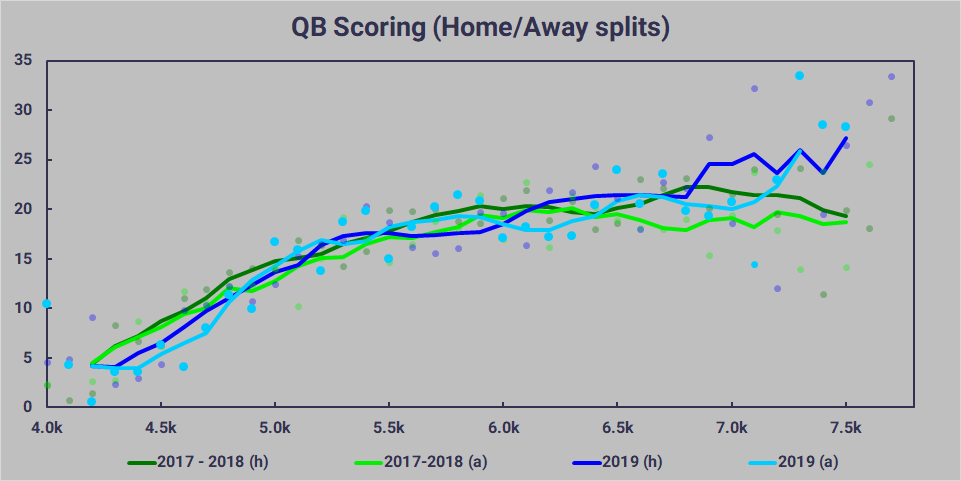
The takeaway from this graph is that there’s little-if-any difference between home and road quarterbacks priced below ~$7k. Scoring from 2019 was also largely consistent with that from 2017-2018, with the $7.1k+ range again spiking up for 2019.
It’s Dynasty Season! Check Out Our Latest Dynasty Content!
What’s interesting about this data is the sample size. There were 20 weeks where a home QB was priced $6.8k or above; but 35 weeks where a road QB was. We would expect the opposite, since both being at home and having a high price are correlated with higher scoring expectation. However, the scoring was higher for the home QBs. This could be due to small sample size. Looking specifically at the spike that separates the home and road scoring at $6.9k, we can see two dark blue dots at $6.9k and $7.1k that raise the smoothed average.
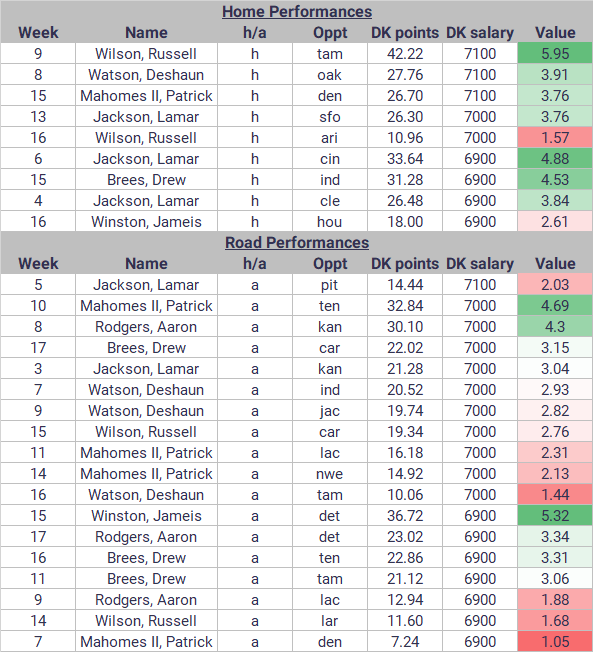
The three home QBs priced at $7.1k all turned in 30-point performances. The sole road QB at that price was Jackson’s worst performance of the season. At $6.9k, three of the four home QBs posted 25+ points and 3.8+ value. Six of the seven road QBs failed to hit those marks. Still, the reason for having 75% more road QB weeks priced at $6.8k and up than home QB weeks is a bit of a mystery.
Top-5 Dynasty QBs for 2020: The Curious Case of Lamar Jackson
One explanation is that QBs going on the road likely played at home the previous week (given the nature of evenly distributing home/away games throughout the schedule) and put up a good performance. Naturally, their price was raised higher than it should have been given the environment. Aaron Rodgers’ Week 8 price of $7k was a $600 increase from Week 7 after putting up 46 points at home against Oakland. Matt Stafford’s Week 9 price of $6.8k was a $700 increase after putting up 27 points at home. Drew Brees’ Week 16 on the road against Tennessee may have been lower had he not put up 31 points the previous week. And Mahomes’ Week 16 price of $6.8k on the road against Chicago if he hadn’t put up 26 points at home against Denver.
Check Out Our 2020 Rookie Profiles!
On the flip side, Rodgers’ poor Week 9 performance on the road against Los Angeles dropped his price to $6.6k Week 10 at home against Carolina. Deshaun Watson’s 5.96 points Week 11 at Baltimore dropped his price from $6.8k to $6.5k at home against Indianapolis. And Russell Wilson’s 11.5 points at Philadelphia in Week 12 dropped his price from $6.8k to $6.6k for a home Week 13 game against Minnesota, lowering the number of high-priced home QBs.
Of course, it could simply be insignificant quirks in DraftKings’ pricing algorithm. However, it will be a trend to keep an eye on in 2020.
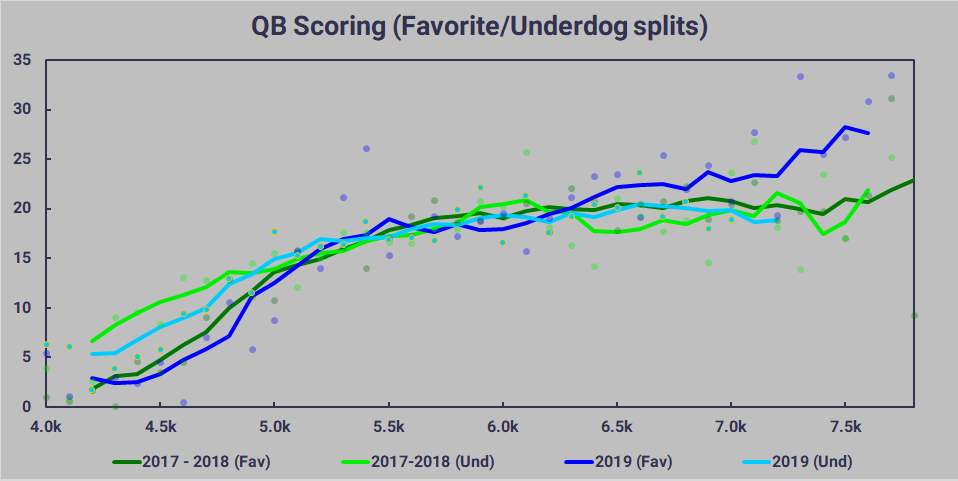
When looking at scoring from a favorite/underdog split, we again see the known break at higher prices. But this break happens earlier, after $6.3k, meaning there’s more data to lend more credence to conclusions. With this split, the sample sizes make more sense. There were 24 underdog quarterbacks priced at $6.4k and up, and as shown by the light blue line stopping earlier than the rest, no underdogs were priced above $7k. By comparison, 89 favored quarterbacks were priced at $6.4k and up, including all 19 instances of a QB priced above $7k.
The graph shows us that, there was still value in prioritizing favored QBs over similarly priced underdogs. At the $6.5k mark, which is the average scoring of QBs priced $6.3k-$6.7k, the 59 favored QBs in the sample scored an average of 2.28 points better than the 22 underdog QBs. Another trend is the even-to-decreasing average points of underdogs above $6.5k. This indicates DraftKings may have been too aggressive in propping up good QBs in underdog spots.


